Viewing and Exporting Results
After you run algorithms or tools, Tetrad produces result nodes in the project tree: graphs, tables, summaries, and diagnostic information. This page summarizes how to inspect and export those results.
Typically, new result nodes appear under the corresponding box (for example, under a Search box or Compare box). You can then double-click them to open the associated view in a new tab.
Graph results
Many algorithms output one or more graphs:
A main search graph (DAG, CPDAG, PAG, MAG, etc.).
Auxiliary graphs such as adjacency graphs, skeletons, or graphs highlighting latent structure or selection bias (depending on the algorithm).
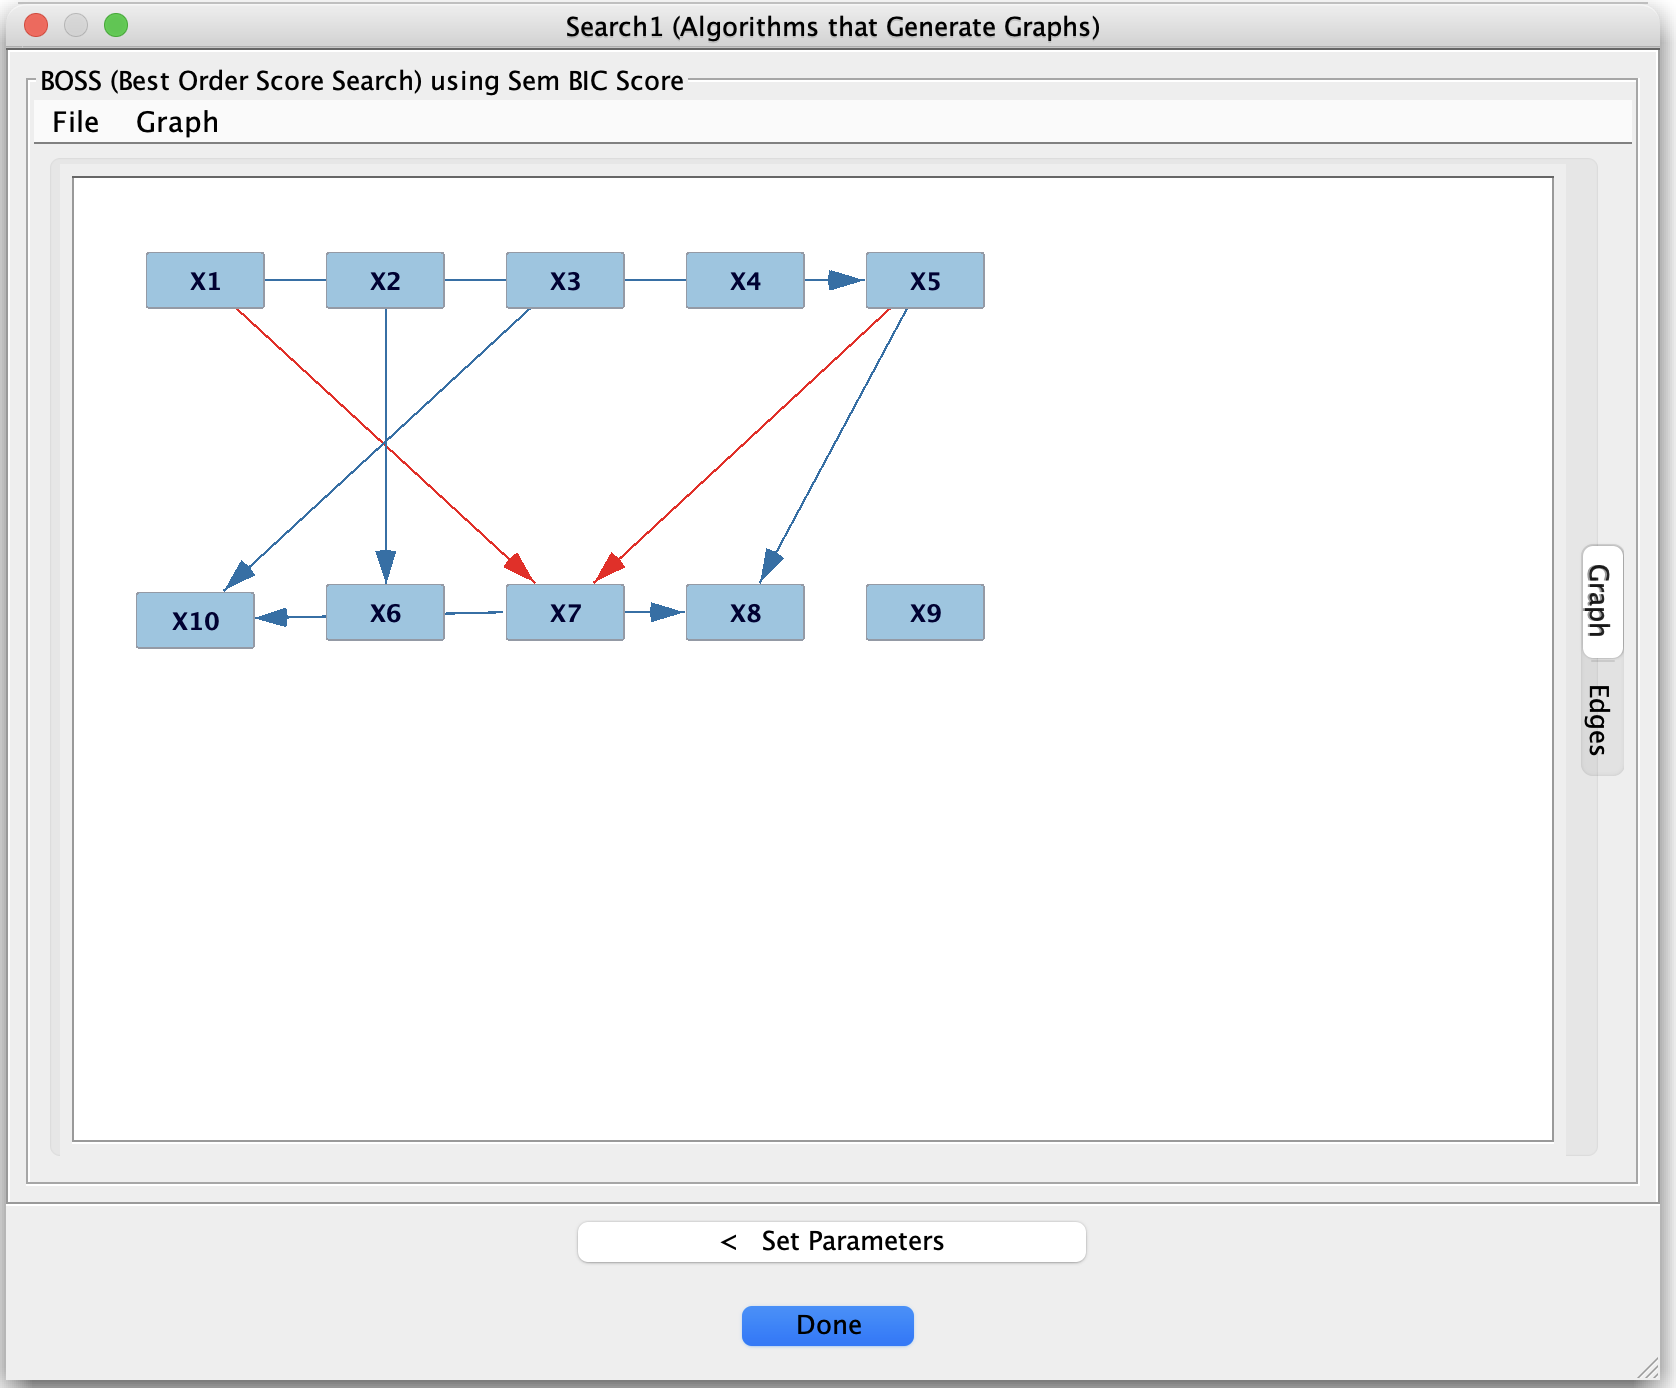
To inspect a graph:
Double-click the graph node in the project tree to open it in the graph editor.
Use the editor to:
Examine edge orientations and endpoint types.
Toggle between different layouts and zoom levels.
Compare multiple graphs by opening them in separate tabs and switching between them.
For more information on editing and interpreting graphs, see the Graph Editor and Graph Box pages.
Tabular and numeric results
Some tools (for example, CStaR, adjustment-set finders, IDA variants, grid search, and stability procedures) produce tables or numerical summaries:
Each row may correspond to:
An edge or variable pair.
An adjustment set or separating set.
A parameter configuration in a grid search.
Columns may include:
p-values, scores, stability frequencies, or bounds.
Effect size estimates and confidence or credible intervals.
Information about adjustment sets, separating sets, or path properties.
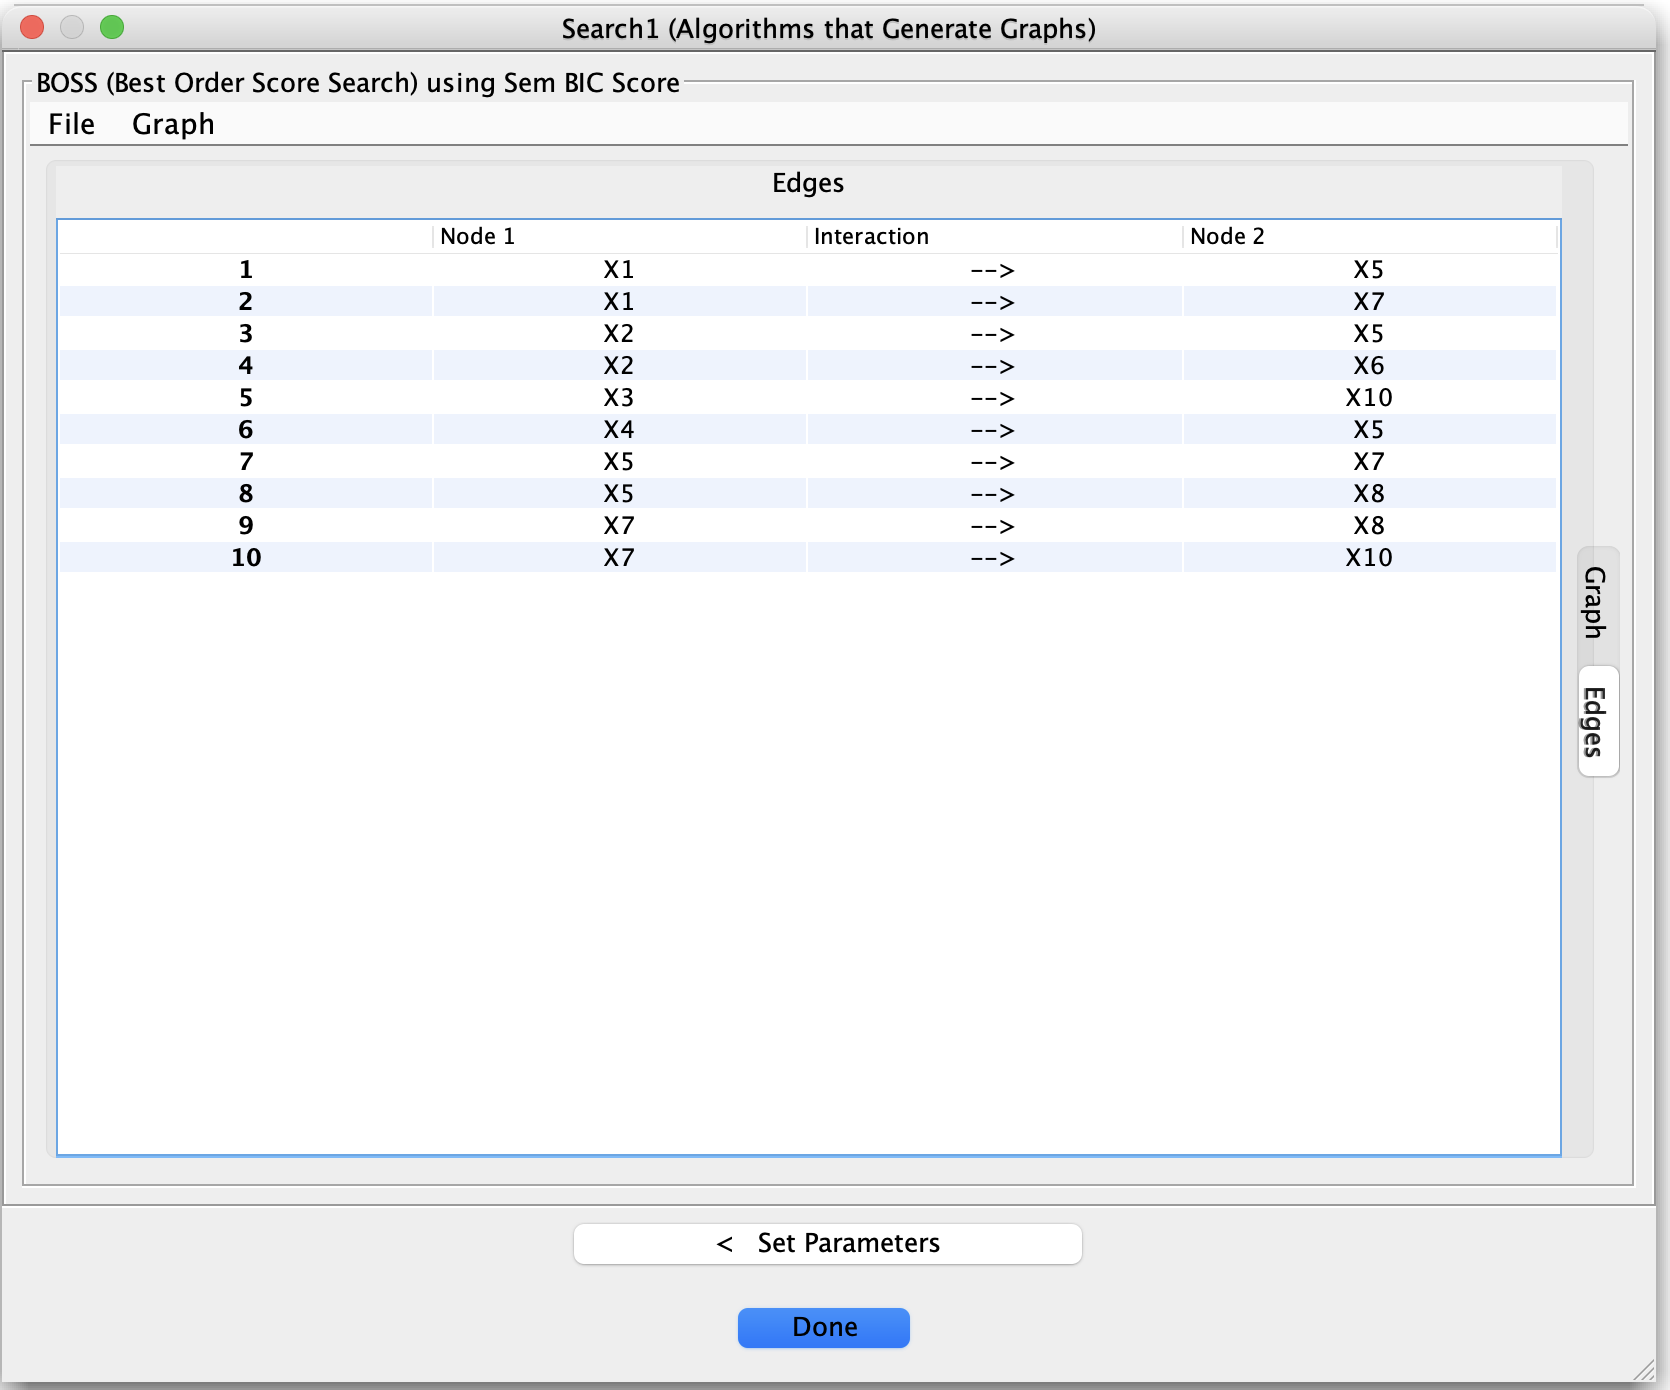
When you double-click a table node:
The table opens in a new tab.
You can usually:
Sort by clicking on column headers.
Resize columns and scroll to view additional information.
Copy small portions of the table for quick reference.
For more complex filtering or plotting, export the table and work in R, Python, or a spreadsheet program.
Exporting graphs and tables
Tetrad lets you export results for use in other tools or for inclusion in papers and reports.
Exporting graphs
From a graph node or an open graph tab, you can:
Export to image (for example, PNG) to include in slides, papers, or documentation.
Export to a text-based graph format (such as a Tetrad
.txtgraph file) to reload later or share with collaborators.
Look for options in:
The graph tab’s File or Export menus, or
The graph node’s right-click context menu in the project tree.
Exporting tables
From a table node or an open table view, you can:
Export to CSV or TSV so you can:
Analyze results further in R or Python.
Make your own plots and summary tables.
Keep a record of settings and outcomes for simulation studies.
Export options are typically available via the table’s File / Export menu or the node’s context menu.
Reusing results in pipelines
Results from one step are often intended as inputs to another:
Use a learned graph as input to:
Adjustment-set algorithms,
IDA and related effect estimation methods,
Latent structure tools.
Use simulated or resampled data as input to additional search algorithms or model-fitting procedures.
Use graphs from grid search or stability analyses as starting points for more focused analyses.
The project tree encourages an incremental workflow:
Load data and run a search.
Inspect and export the resulting graph or table if needed.
Use those results as inputs to new boxes (Compare, Updater, Regression, etc.).
Save the entire session to preserve data, graphs, configurations, and results together.