Simulation Box
Simulation Box in the Tetrad interface sidebar and main panel.
Purpose
The Simulation box is where you generate synthetic data and corresponding ground-truth graphs in a Tetrad project. It provides a self-contained workflow to:
choose a graph type,
choose a simulation type (data-generating mechanism),
set simulation parameters (sample size, average degree, number of measures, number of latents, etc.), and
produce both a true graph and one or more simulated datasets.
The resulting true graph is shown in the True Graph tab, and the simulated data is shown in the Data tab. These outputs can then be extracted to other boxes (Graph, Data, Search, Compare, etc.) for downstream analysis.
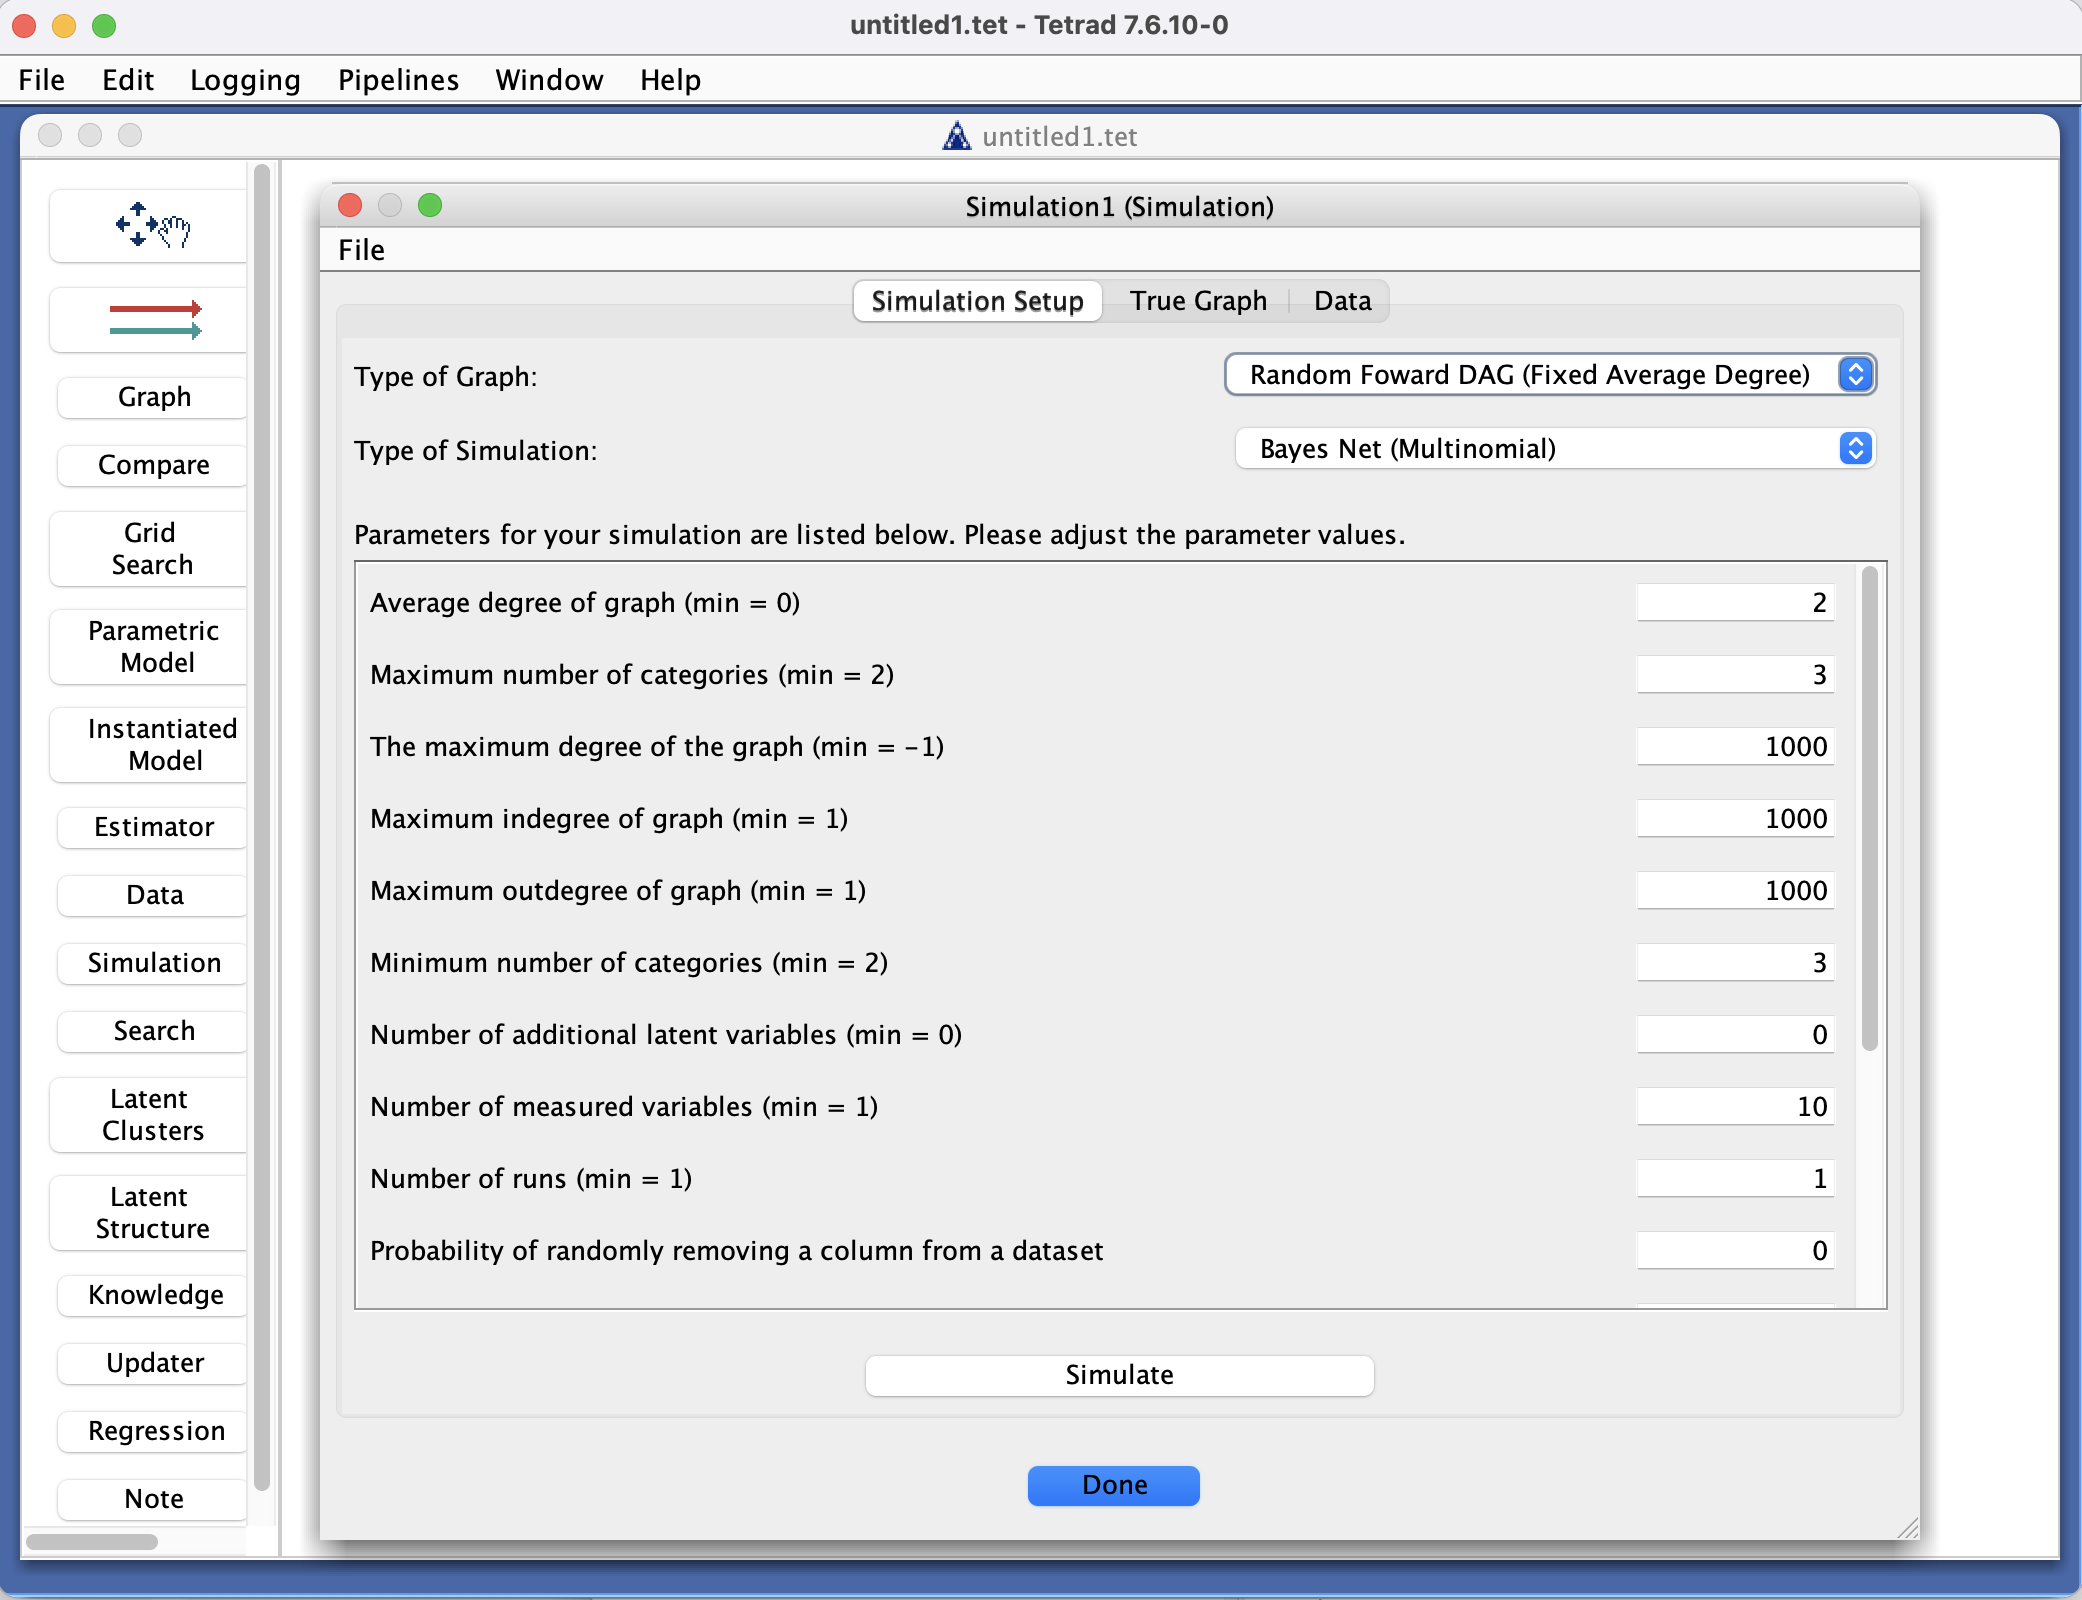
Simulation setup
When you place a Simulation box on the workbench and double‑click it, you start on the Simulation Setup tab. This tab offers two main choices:
Graph type
You can choose how the underlying graph is generated. Typical options include:Random Forward DAG
Erdos–Renyi DAG
Scale‑Free DAG
Cyclic
Random MIM (Multiple Indicator Model)
Simulation type
You can then choose how data are generated from the graph. Options include:For short descriptions of each simulation type, see the detail callout:
Linear SEM
Linear Fisher
Gaussian Process
Nonlinear Additive (CAM = Causal Additive Model)
Additive Noise SEM (Deep net)
Mixed Lee & Hastie
Mixed Conditional Gaussian
Time Series
Once a graph type and simulation type are selected, parameters specific to that combination are displayed in the panel below. These parameters can be edited directly. Examples include:
Average degree of the graph,
Number of measures,
Number of latent variables,
Error variances or noise scales,
Time‑series length and lag structure (for time-series simulators),
And many others.
For a complete list of parameters, their types, and allowable ranges, see the Parameters page in the manual (via the Parameters entry in the sidebar). That page documents all simulation parameters in one place.
Running a simulation
On the Simulation Setup tab:
Choose a graph type.
Choose a simulation type.
Adjust any parameters you care about (average degree, number of measures, number of latents, sample size, etc.).
Click Simulate.
The simulator generates:
A true graph (typically a DAG), shown on the True Graph tab.
A simulated dataset, shown on the Data tab.
Inspect the results:
On the True Graph tab, you can view the generating graph and verify characteristics such as density, presence of cycles (for cyclic simulations), or the latent structure (for Random MIM).
On the Data tab, you can quickly check that variable names and basic patterns look as expected.
To run another simulation:
Return to the Simulation Setup tab,
Choose a new graph type and/or simulation type, or modify parameter values,
Click Simulate again. The True Graph and Data tabs update to reflect the new simulation.
Using simulated graphs and data in other boxes
Simulated graphs and datasets created by the Simulation box can be fed into other parts of the Tetrad project:
Extracting the dataset
Create a new Data box on the workbench.
Draw an arrow from the Simulation box to the new Data box.
Double‑click the Data box to inspect and use the simulated dataset (it will appear as one of the datasets in that box).
Extracting the graph
Create a new Graph box on the workbench.
Draw an arrow from the Simulation box to the new Graph box.
Double‑click the Graph box to view and manipulate the simulated true graph.
Searching on simulated data
Place a Search box on the workbench.
Draw an arrow from the Simulation box (or, more commonly, from the Data box containing the simulated data) to the Search box.
Double‑click the Search box and configure a search algorithm.
Run the search to see how well it recovers the true graph.
Other downstream uses
Use the simulated data in Regression, Estimator, or Compare boxes to:
Evaluate parameter estimators,
Compare different search algorithms or scoring rules,
Build teaching or demonstration examples with known ground truth.
Common patterns & tips
Use fixed seeds (where available) when you want simulations to be reproducible across sessions.
When benchmarking:
Fix a simulation setup (graph type, simulation type, parameters),
Generate data,
Run multiple algorithms or parameterizations on the same simulated data,
Use the Compare and Estimator boxes to evaluate performance against the known true graph.
When exploring robustness:
Vary simulation types (e.g., Linear SEM vs. Nonlinear Additive) while keeping the graph type similar,
Then examine which algorithms are more sensitive to nonlinearity, mixed types, or time series structure.