Simulation and Utilities
In Tetrad, simulation and related utilities are organized around boxes on the workbench.
You compose workflows by connecting Graph, Parametric Model, Instantiated Model, Simulation,
Data, Search, Grid Search, and Compare boxes rather than using a global Tools menu.
Simulating data on the workbench
There are two common ways to simulate data from a model in Tetrad, both using boxes.
1. Quick simulation from a graph
A simple workflow is:
Place a Simulation box on the workbench and (optionally) connect it to a Graph box
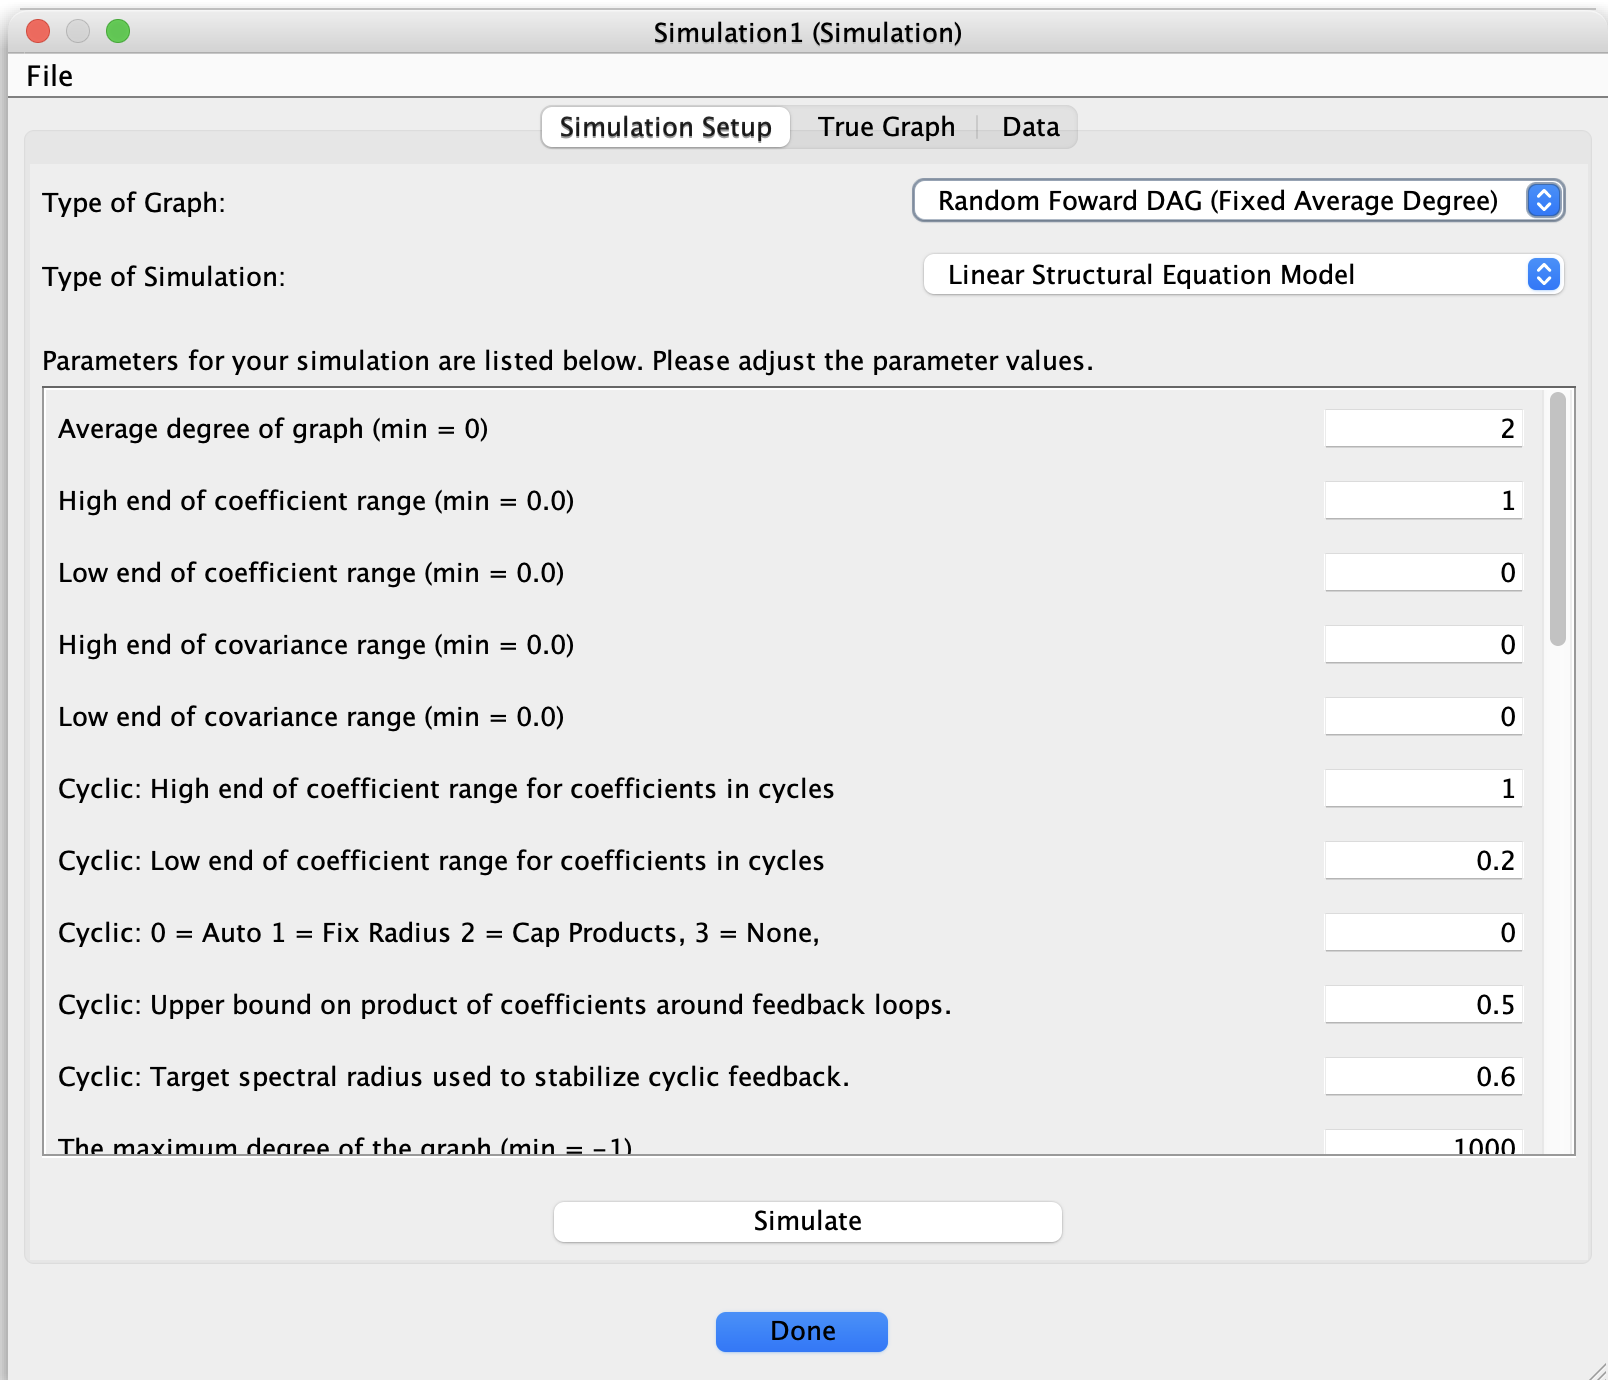
that supplies a causal DAG.Double-click the Simulation box to open its configuration dialog.
Configure:
Number of cases (sample size),
Error distributions (Gaussian, non-Gaussian, etc.),
Whether to add measurement error or missingness.
Click Simulate.
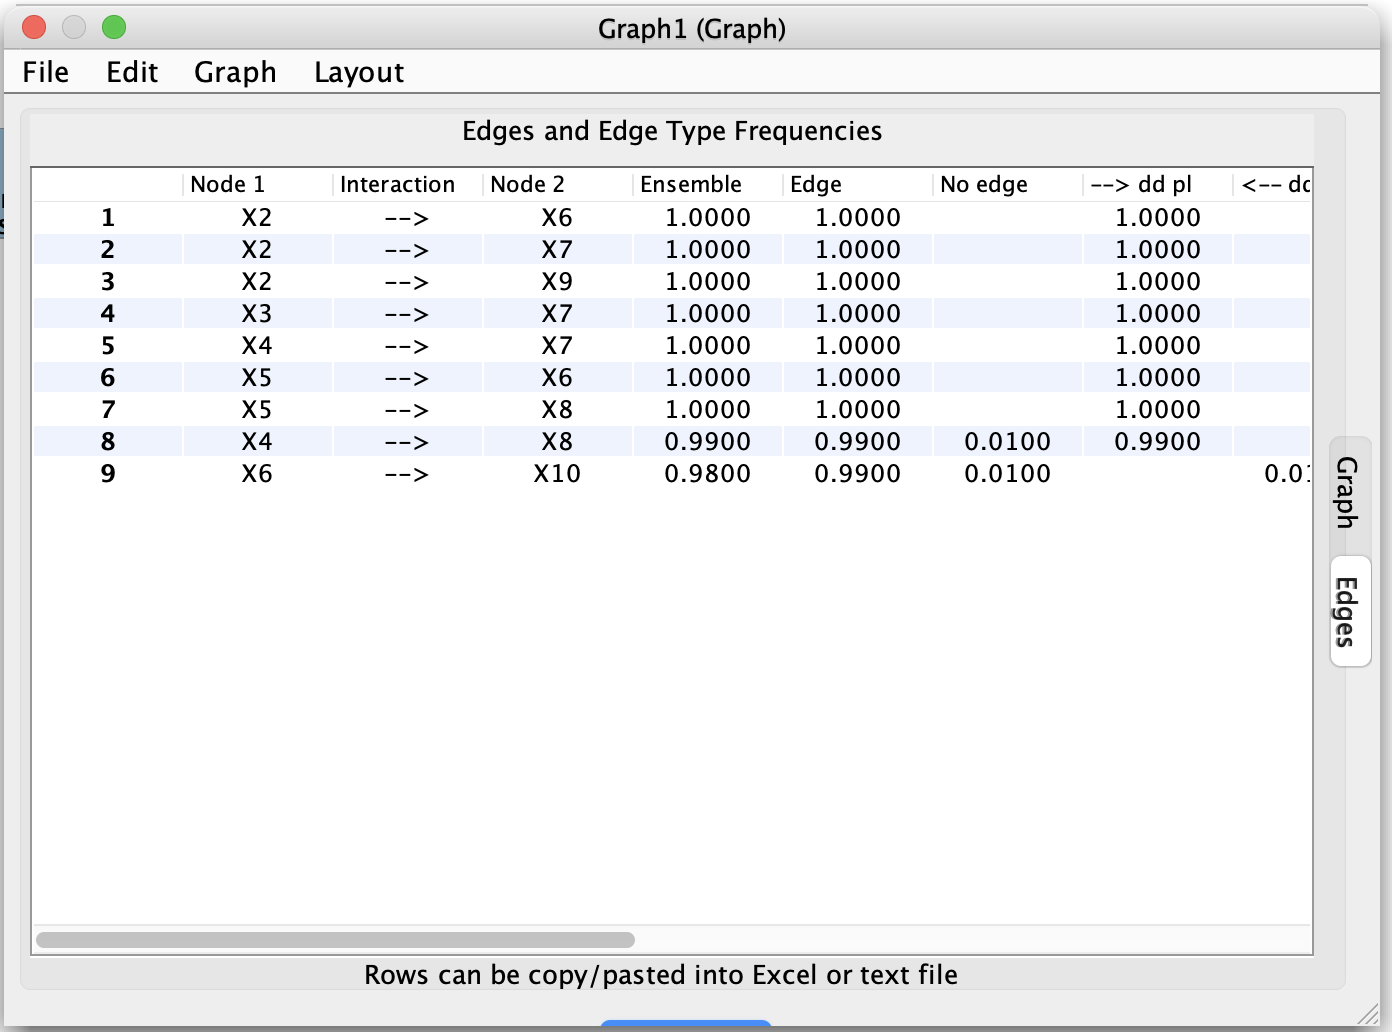
The Simulation box then produces:
A graph node representing the generative structure (if one was specified), and
A data node representing the simulated data set.
You can connect this data directly to a Search box to run a causal search on the simulated data.
2. Simulation from a parametric or instantiated model
For more structured workflows:
Use a Graph box plus a Parametric Model box to define a model family (Bayes, SEM, Hybrid, Generalized), or start from an Instantiated Model box that already contains a fitted model.
Connect the Parametric/Instantiated Model box to a Simulation box.
Connect the Simulation box to a Data box (to hold the simulated data) and then to a Search box.
In this setup you can:
Generate simulated data directly from a fully specified statistical model.
Immediately run search algorithms on the simulated data in the same pipeline.
Repeat runs by changing model parameters, simulation settings, or search configurations and re-running the connected boxes.
Simulation is useful for:
Benchmarking algorithms on known ground-truth graphs or models.
Creating teaching examples.
Exploring the impact of different noise models, sample sizes, and missingness mechanisms.
Resampling and bootstrap workflows
Some Simulation configurations and related boxes support resampling:
Bootstrap resampling of an existing data set,
Subsampling or repeated-split strategies to assess the stability of learned graphs or parameter estimates.
A typical pattern is:
Start with a Data box that points to your original data.
Attach a Simulation or resampling-oriented box that takes this Data box as input and produces new Data boxes representing bootstrap samples or resampled data sets.
Connect those resampled Data boxes to Search or Grid Search boxes to:
Evaluate stability of adjacencies and orientations,
Summarize performance across repeated samples.
These resampling pipelines integrate naturally with stability-oriented tools such as CStaR and with Grid Search (see below).
Grid Search (overview)
The Grid Search box (documented in a separate detail callout) lets you explore how algorithm performance depends on parameter choices.
With Grid Search you can:
Choose a base algorithm configuration (for example, a Search box using FGES or PC).
Specify a grid of parameter values (for example, different
alphalevels or penalty discounts).Run the algorithm for every combination in the grid.
Collect results as:
Tables of performance or fit statistics,
Sets of graphs that can be compared or summarized.
On the workbench, Grid Search fits naturally into pipelines such as:
Data → Search → Compare (single configuration),
Data → Grid Search → Compare (multiple configurations),
Data → Simulation → Grid Search → Compare (simulation studies over parameter grids).
For details, see Detail: Grid Search.
Other utilities
In the version of Tetrad described in this manual, additional utilities are also expressed as boxes and connections between them. Common patterns include:
Data transformations
Attach a new Data box to an existing one and select a transformation (for example, variable selection, standardization, or simple recoding). The new Data box represents the transformed data set.Graph conversions and checks
Use boxes that convert graphs between types (e.g., DAG ↔ CPDAG ↔ PAG) or simplify graphs by removing certain edge types. Other boxes check that graphs satisfy type-specific constraints (for example, acyclicity, valid PAG markings, or legal MAG/PAG edge endpoints).Model checking and diagnostics
Boxes such as Markov Check attach to a graph and a Data box to evaluate whether a model is approximately Markov with respect to the data and to summarize deviations.
Several of these utilities are documented in their own pages elsewhere in the manual (for example, Detail: Grid Search and Detail: Markov Check). Refer to the table of contents for links to those tools and their usage patterns.