Detail: IDA Check (Regression box)
The IDA Check panel in the Regression box is designed mainly for
evaluating IDA-based total effect estimates in simulation studies, where
the true total effects are known from the generating DAG.
It computes Maathuis-style IDA intervals, optionally Optimal IDA intervals,
and compares them to the true total effects variable–pair by variable–pair.
IDA Check (updated UI with Treatments/Outcomes and Run button)
Layout and controls
The IDA Check window contains:
Table / Help tabs (top)
Table – shows the main IDA summary table (default view).
Help – displays a short explanation of the panel and references.
Treatments (X) (text field)
A list of variables (or patterns) to treat as treatments. These define the left-hand side of the ordered pairs (X, Y) shown in the table.Outcomes (Y) (text field)
A list of variables (or patterns) to treat as outcomes. These define the right-hand side of the ordered pairs (X, Y) shown in the table.Both fields support:
Comma- or whitespace-separated names, for example:
X1, X2, X3
Simple wildcard patterns using:
*– matches any sequence of characters (including empty)?– matches any single character
Examples:
X*– all variables whose names start withX?bar– any one-letter prefix followed bybar(for exampleAbar,Zbar)
Hide zero-effect pairs (checkbox) When enabled, ordered pairs whose IDA interval is exactly [0, 0] are omitted from the table.
Run (button)
After editing Treatments (X) and/or Outcomes (Y), click Run to:validate the patterns,
construct the sets of matching variables for X and Y, and
recompute the IDA table for all ordered pairs (X, Y) with X in the Treatments set and Y in the Outcomes set.
If either set is empty, or if no ordered pairs are matched, an error dialog is shown and the table is not updated.
Show Optimal IDA (checkbox)
Unchecked – uses standard IDA (Maathuis et al., 2009).
Checked – uses Optimal IDA (Witte et al., 2020), which tightens or refines the IDA interval when possible by using O-sets.
This option is only enabled when the estimated graph is a legal PDAG (as required for the Optimal IDA logic). Otherwise the checkbox is disabled.
IDA summary table (central area)
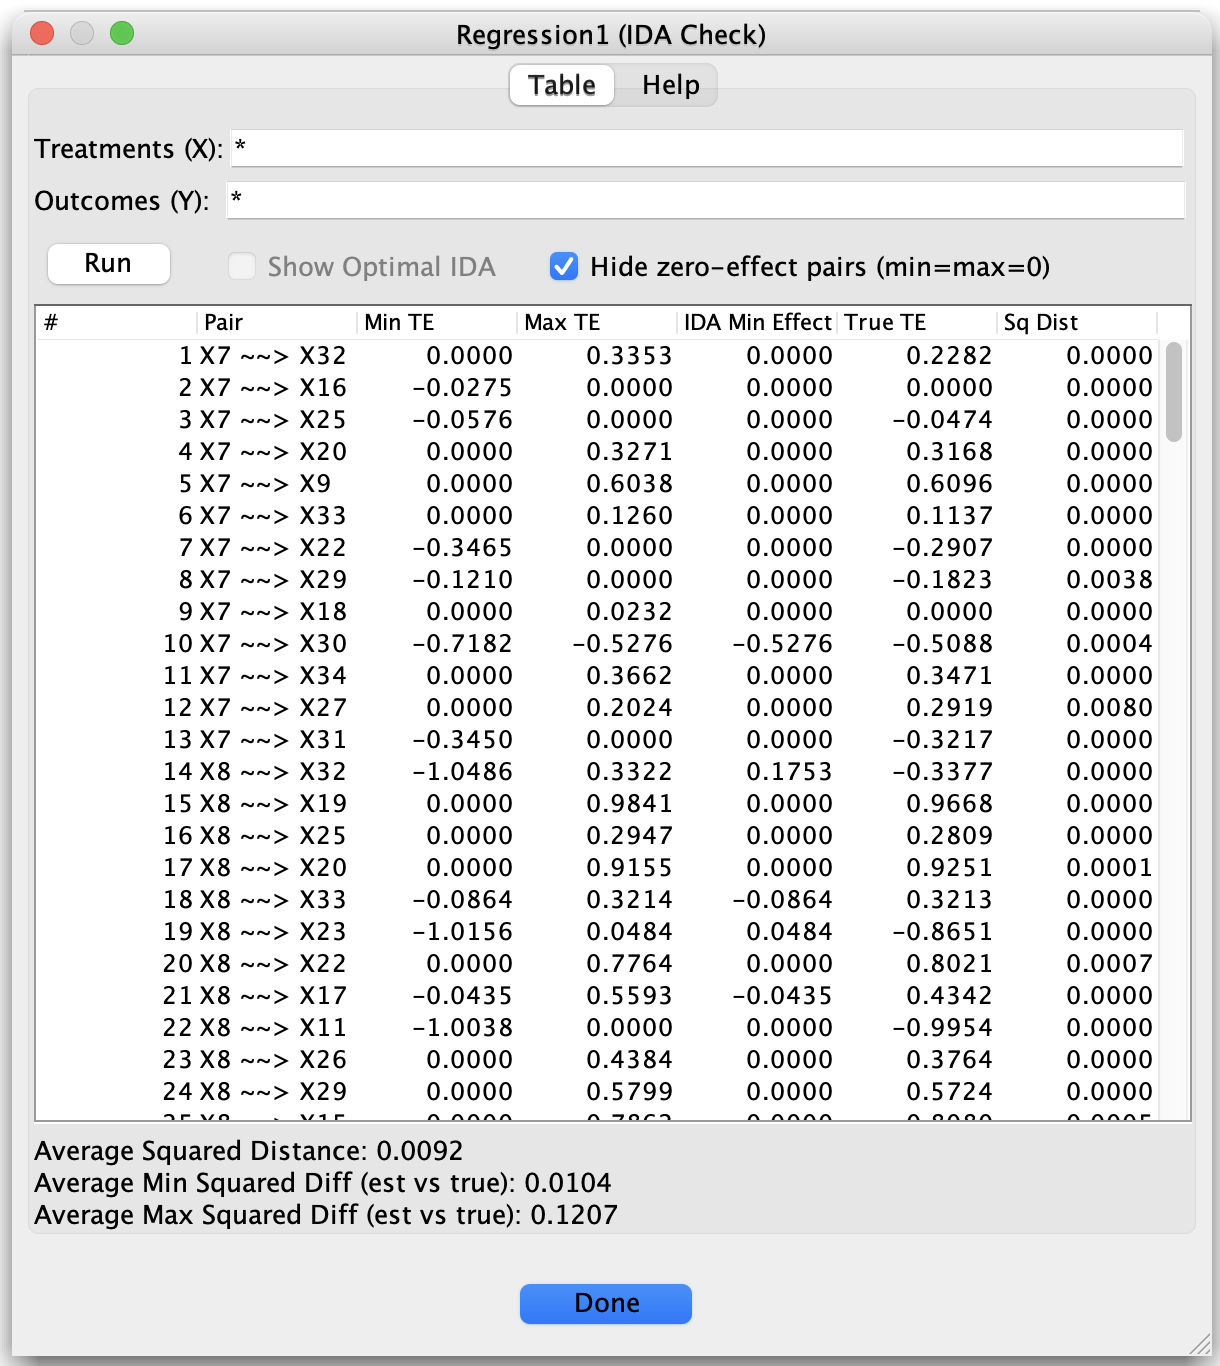
One row per ordered pair, displayed asX ~~> Y, interpreted as the total effect of treatment X on outcome Y.The table is sortable by clicking column headers; the summary statistics at the bottom are computed over the rows currently visible in the (sorted) table.
Summary statistics (bottom area, simulation only)
If a true SEM is available, the bottom of the panel reports aggregate measures of how well the IDA intervals match the true total effects across all visible rows.
Table columns
Each row in the table corresponds to one ordered pair (X, Y), displayed as:
Pair
Shown asX ~~> Y, meaning:Treatment = X
Outcome = Y
The remaining columns are:
Min TE
The minimum total effect of X on Y over all DAGs and parent sets consistent with the current graph (using standard or Optimal IDA, depending on the checkbox). This is the left endpoint of the IDA interval.Max TE
The maximum total effect of X on Y over all compatible DAGs and parent sets (again, standard vs Optimal IDA depending on the checkbox). This is the right endpoint of the IDA interval.IDA Min Effect
The IDA point estimate used in the evaluation. This is the signed total effect whose absolute value is minimal among the IDA effects for the pair.
True TE
The true total effect of X on Y, computed from the generating DAG (available only in simulation when a true SEM is supplied).Sq Dist
The squared distance between the true total effect and the IDA interval:0 if
True TElies inside the interval[Min TE, Max TE](including endpoints),otherwise, the square of the distance from
True TEto the nearest endpoint of the interval.
Intuitively,
Sq Distmeasures how far the IDA interval misses the truth, if at all, on a per-pair basis.
As before, when no true SEM is available:
Columns that require the truth (
True TE,Sq Dist, and related diagnostics) are omitted, andThe panel simply reports IDA/Optimal IDA intervals for the selected pairs.
Summary statistics (bottom)
When a true SEM is available, the text at the bottom aggregates diagnostics over the rows currently visible in the table (after sorting):
Average Squared Distance
The mean ofSq Distover all visible pairs. This is a one-number summary of how well the IDA intervals capture the true total effects.Average Min Squared Difference Est True
The average squared difference between the left endpoint (Min TE) and the true effect, over visible pairs.Average Max Squared Difference Est True
The average squared difference between the right endpoint (Max TE) and the true effect, over visible pairs.
These quantities are useful for comparing algorithms: you can run different search procedures (FCI, GFCI, FCIT, LV-based methods, and so on), open the IDA Check panel for each resulting graph, and compare the summary statistics to see which graphs yield better IDA intervals relative to the known truth.
Typical usage
Run a search algorithm on data where the true DAG (and hence true total effects) are known, or on real data if you wish to inspect IDA intervals without a truth baseline.
Open the Regression box and select the IDA Check component.
In the Table tab:
Enter one or more Treatments (X) and Outcomes (Y), using names or wildcard patterns (
*,?).Click Run to compute IDA intervals for all pairs (X, Y) with X in the Treatments set and Y in the Outcomes set.
Optionally check Show Optimal IDA (if enabled) to switch to the Optimal IDA variant (O-sets).
Inspect:
The table for particular pairs of interest (
Pair,Min TE,Max TE, and, if available,True TE,Sq Dist).The summary statistics at the bottom to assess overall IDA performance for the visible subset of pairs.
Repeat with graphs from different algorithms or with different X/Y selections to explore how graph structure and adjustment choices affect IDA-based total effect estimation.
Notes and references
The IDA method implemented here is based on:
Maathuis, M. H., Kalisch, M., & Bühlmann, P. (2009).
Estimating high-dimensional intervention effects from observational data.
The Annals of Statistics, 37(6A), 3133–3164.
The Optimal IDA option follows the O-set construction of:
Witte, J., Henckel, L., Maathuis, M. H., & Didelez, V. (2020).
On efficient adjustment in causal graphs.
Journal of Machine Learning Research, 21(246), 1–45.
For real data (no true SEM), only the estimated intervals are shown; the panel then serves as a way to inspect empirical bounds on total effects for selected treatment–outcome pairs.