Search Box
Search Box in the Tetrad interface sidebar and main panel.
Purpose
The Search box is where you run causal discovery algorithms in Tetrad. It connects:
one or more datasets (from the Data box),
an independence test and/or score (depending on the algorithm),
optional background knowledge (from the Knowledge box),
and a search algorithm (e.g., PC, FCI, GFCI, RFCI, CFCI, FCIT, FGES, BOSS, GRaSP),
and produces one or more graphs that appear in the Graph box.
The Search box is implemented as a wizard with multiple cards. You choose the algorithm, test, and score on the first card, then set their parameters on the second card, and finally run the search to obtain a result graph.
Typical uses include:
Learning causal graphs from observational or simulated data.
Comparing different algorithms or parameter choices on the same dataset.
Incorporating background knowledge to refine the search.
Wizard workflow
Double-clicking a Search box opens a wizard with two main cards:
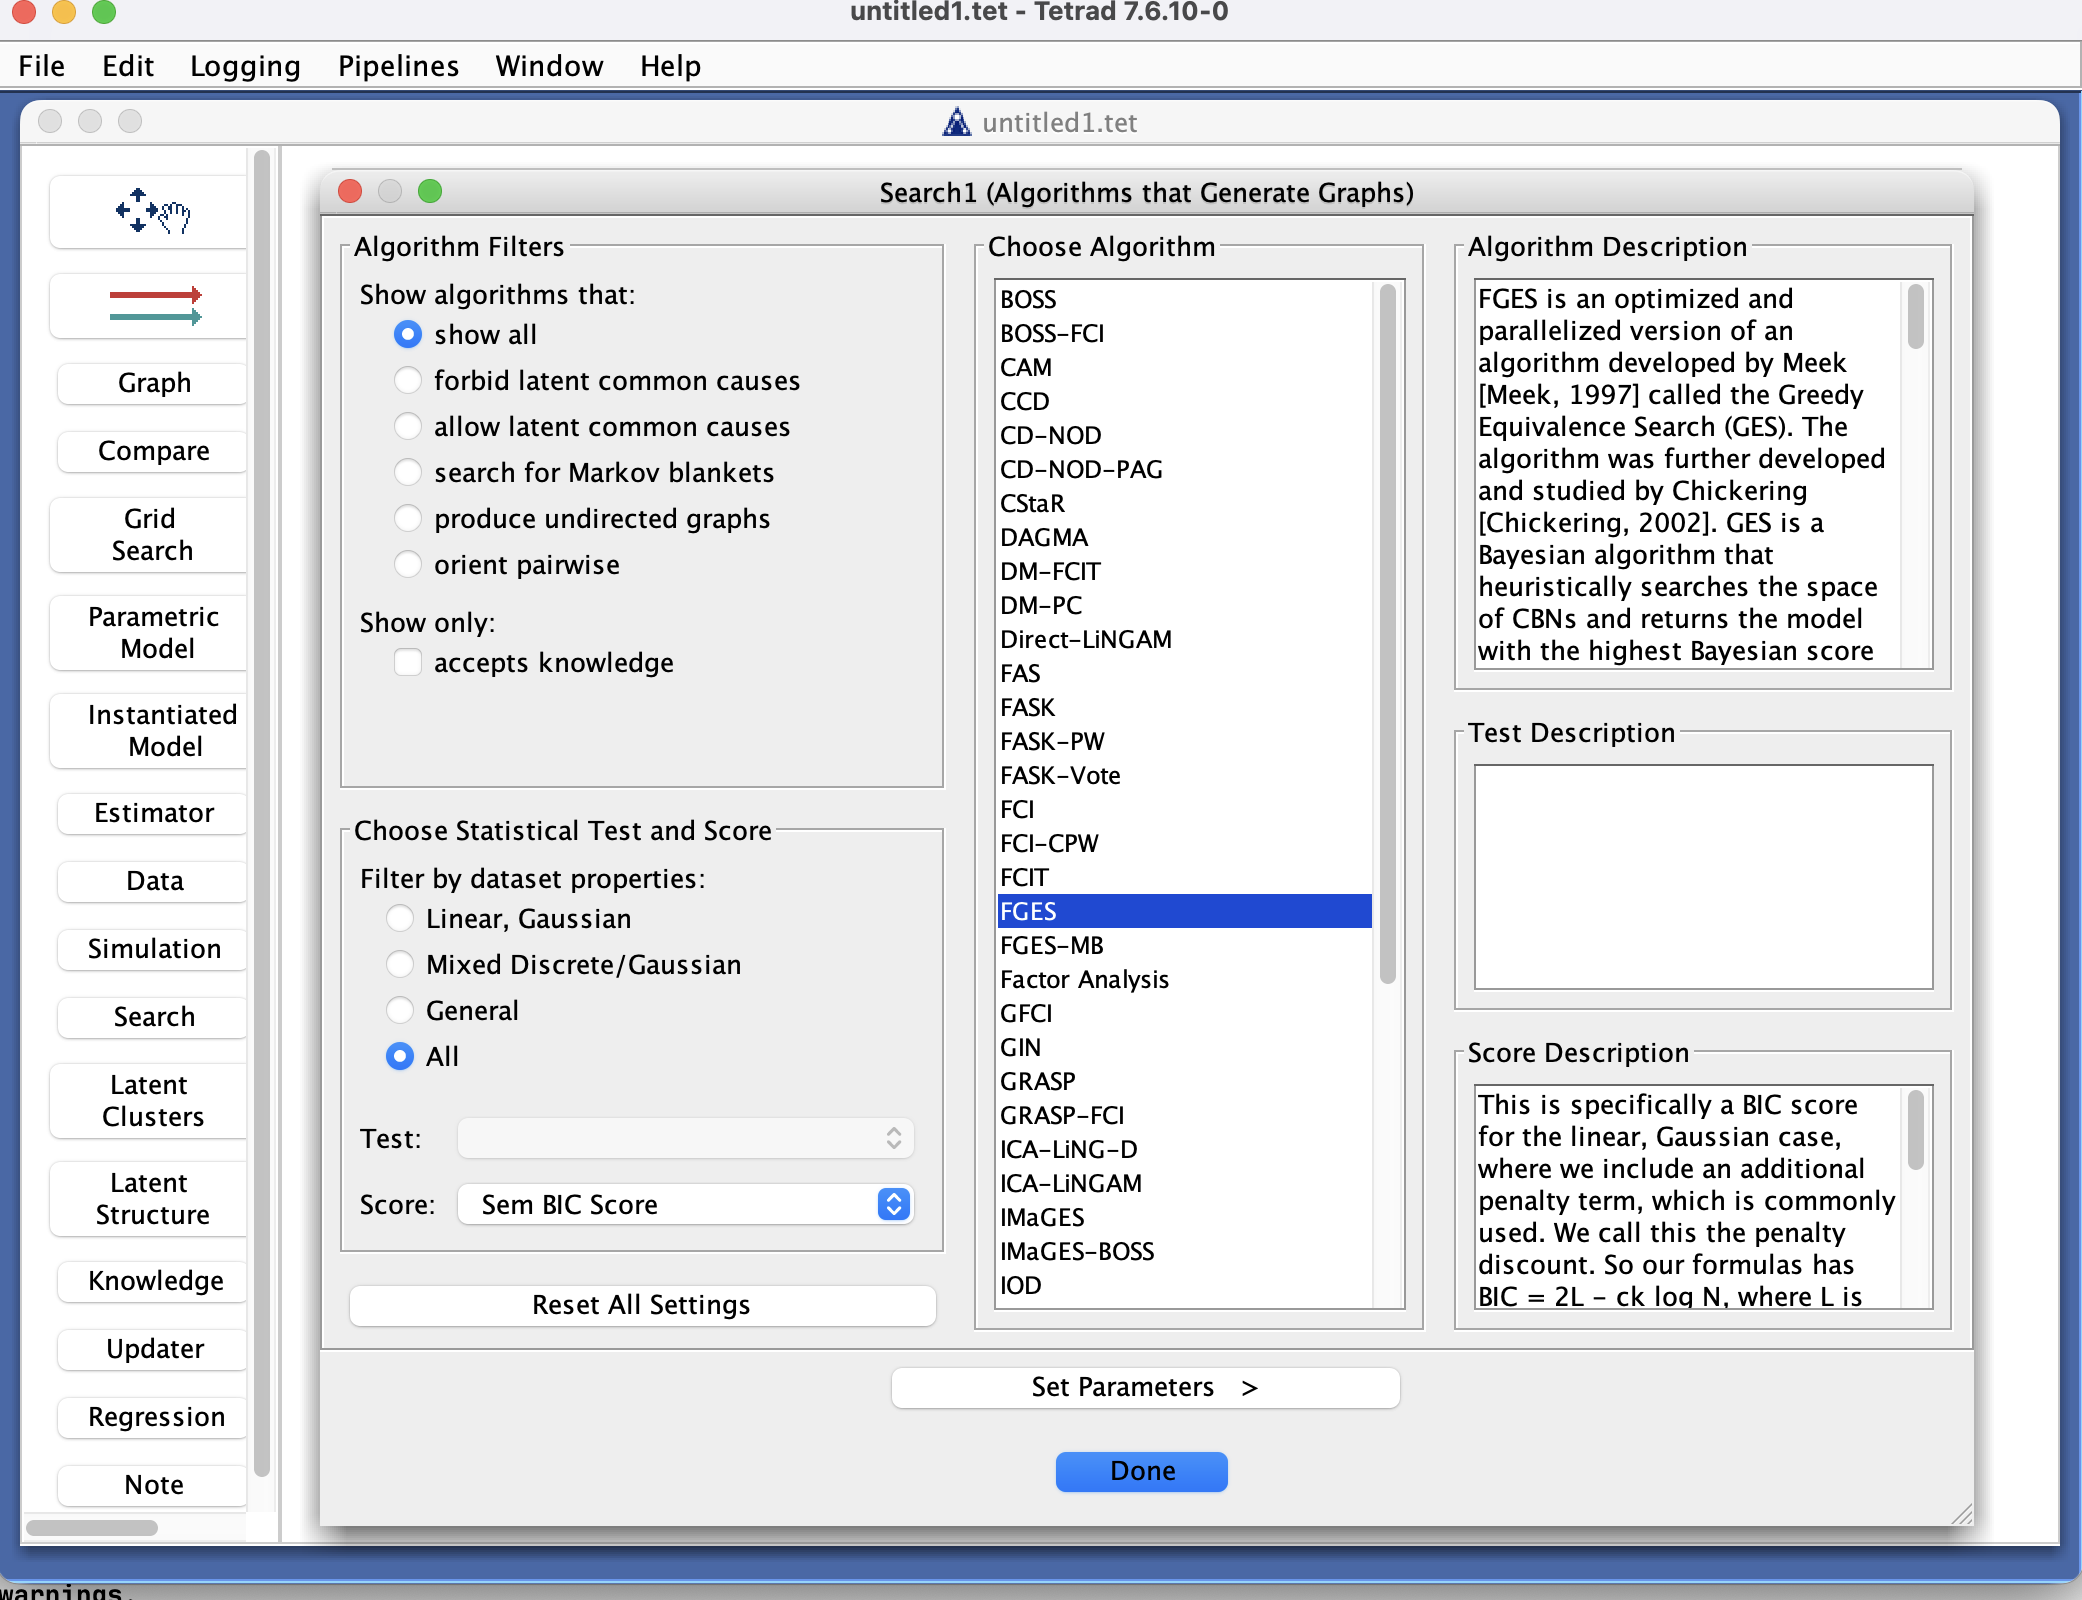
Card 1: Choose algorithm, test, and score
The first card focuses on selecting an algorithm (consistent with your data type) and, where required, an independence test and/or score.
Algorithm selection
At the top, you choose an algorithm from a combo box (a list selector, not a simple drop-down).
Algorithm filters help narrow the list to methods appropriate for:
Continuous vs. discrete vs. mixed data,
Presence or absence of latent variables and/or selection bias,
Constraint-based vs. score-based vs. hybrid algorithms.
When you highlight an algorithm, a description appears on the right, explaining:
What type of input it expects,
What assumptions it makes,
What kind of output graph it produces (DAG, CPDAG, PAG, etc.).
Test and score selection
In the lower-left portion of the card, you choose:
An independence test (for constraint-based and hybrid algorithms) and/or
A score (for score-based and hybrid algorithms), depending on what the selected algorithm requires.
There is a filter for tests and scores as well, to help you quickly find options that match:
Data type (e.g., Gaussian, discrete, mixed),
Special features (e.g., kernel-based, robust variants).
When you select a test or score, its description is also shown on the right for reference.
Once you are satisfied with your choices of algorithm, test, and score, click Set Parameters at the bottom of the wizard to move to the second card.
Card 2: Set parameters and run
The second card shows parameters for the chosen algorithm, test, and/or score. Here you can:
Edit algorithm parameters, such as:
Significance level (\alpha),
Penalty discount or BIC weight,
Maximum search depth or maximum path length,
Flags for allowing latent variables or selection bias (for FCI-style algorithms),
Any algorithm-specific tuning parameters.
Edit test parameters, such as:
Test type–specific options (e.g., kernel bandwidth, number of permutations),
Robustness or small-sample options (where applicable).
Edit score parameters, such as:
Prior weights or equivalent sample size,
Model class–specific options (e.g., SEM vs. hybrid scores).
For more detailed explanations of what each parameter means, what type it has, and allowable ranges, consult:
The documentation page for the algorithm, test, or score, or
The global Parameters listing in the manual, which lists all Tetrad parameters in one place.
From this card you can:
Click Choose Algorithm to go back to the first card and pick a different algorithm/test/score combination.
Click Run Algorithm to execute the search with the current settings.
When you click Run Algorithm, the search is executed and a resulting graph is produced and added to the Graph box. The Search box remembers your configuration so you can re-run or tweak it later.
Connecting data, knowledge, and outputs
Although the wizard focuses on algorithm/test/score choices and parameters, the Search box still sits in the larger workflow of the project:
Inputs
Draw an arrow from a Data box into the Search box to provide the dataset.
(Optional) Draw an arrow from a Knowledge box into the Search box to provide background knowledge (forbidden/required edges, tiers, etc.).
Outputs
When the algorithm finishes, the resulting graph is sent to a Graph box.
You may attach multiple Graph boxes if you want to keep different runs separate.
You can also duplicate a Search box on the workbench to explore variations of the same design (e.g., different alpha levels, different scores, or different handling of latents).
Common patterns & tips
Choose algorithms that match the assumptions of your setting:
Use FCI-style methods when latent confounders or selection bias are plausible.
Use PC or FGES when you are comfortable assuming no latent variables or selection.
Use algorithm filters on the first card to quickly narrow down to algorithms designed for your data type.
Use test/score filters to avoid selecting combinations that are incompatible with your data (e.g., discrete tests for continuous-only data, or vice versa).
When exploring parameter sensitivity:
Duplicate a Search box on the workbench.
On each copy, use the wizard to change one parameter (e.g., alpha, penalty discount) while keeping others fixed.
Use the Compare box to contrast the resulting graphs against each other and, where available, against a true graph.