Detail: Display Subgraphs
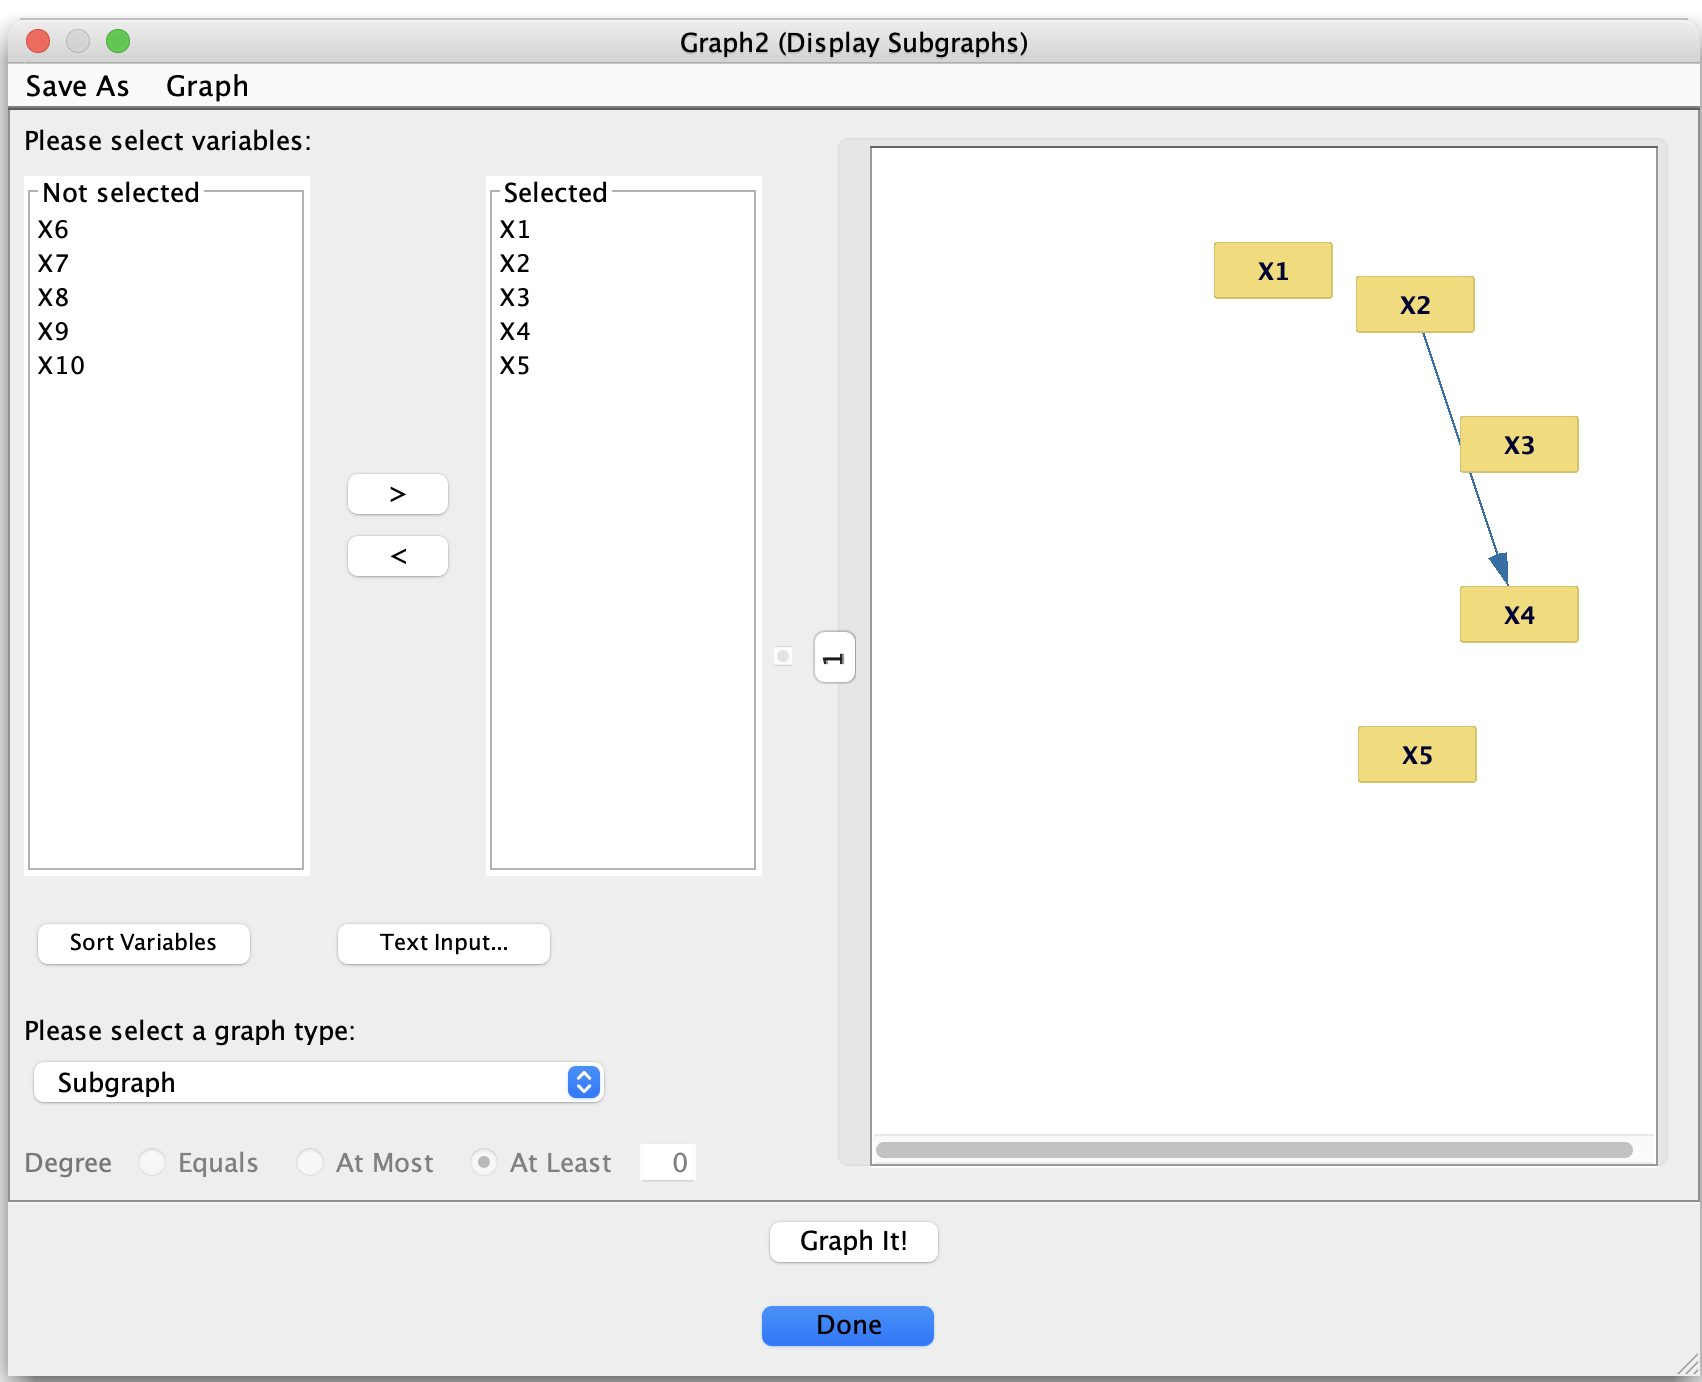
Display Subgraphs dialog for extracting subgraphs from a larger graph.
Purpose
The Display Subgraphs tool is designed to help you explore large, complicated graphs by extracting and visualizing subgraphs of interest. Instead of working with the entire graph at once, you can:
Select a subset of variables,
Choose a subgraph type (e.g., neighbors, ancestors, paths, Markov blankets),
Click Graph It! to open a new Graph window containing only the relevant part of the graph.
This is invaluable for understanding local neighborhoods, causal families, and path structures in large graphs.
Basic workflow
Open Display Subgraphs
From a Graph window, choose the Display Subgraphs tool (for example, via the Graph menu).
Select variables
The dialog shows two lists:
Not selected – variables currently excluded from the subgraph,
Selected – variables currently included.
Use the > and < buttons to move variables between lists.
Sort Variables orders the variable names alphabetically.
Text Input… lets you specify a list of variables by name.
Choose a subgraph type
At the bottom, use the graph type drop-down to choose what kind of subgraph to construct.
Depending on the type, all nodes and edges that satisfy the requested relationship (adjacency, ancestry, path relation, degree condition, and so on) are included in the subgraph.
(Optional) Degree filter
For degree-based options you can specify:
Whether the degree should equal, be at most, or at least a given number,
The numerical threshold in the text field.
Graph it
Click Graph It! to create and display the subgraph in a new Graph window.
The original graph is left unchanged; you can open multiple subgraph windows for comparison.
Click Done to close the dialog when you are finished.
Subgraph types
The graph-type drop-down offers the following subgraph types:
Neighborhood-based selections
Subgraph
Shows the induced subgraph on the selected variables: all selected nodes and all edges between them.Adjacents
For the selected variables, includes each selected node plus all of its neighbors (adjacent nodes) and the edges among them.Adjacents of Adjacents
Extends Adjacents one step further: includes selected nodes, their neighbors, and the neighbors of those neighbors.Adjacents of Adjacents of Adjacents
Extends the neighborhood out to three adjacency steps from the selected nodes.
Family / causal-relation selections
Parents
Selected nodes plus all of their parents and the edges between them.Children
Selected nodes plus all of their children and the edges between them.Ancestors
Selected nodes plus all of their ancestors (nodes with a directed path into them) and all connecting edges.Descendants
Selected nodes plus all of their descendants (nodes reachable by directed paths out of them) and the relevant edges.Markov Blankets
For each selected node, includes its Markov blanket (typically its parents, its children, and the parents of its children), along with all edges among these nodes.
Path-based selections
These focus on paths and treks involving the selected variables.
Treks
Subgraph consisting of treks (paths without colliders) involving the selected nodes.Trek Edges
Only the edges that lie on those treks, together with their endpoints.Paths
Subgraph containing paths involving the selected nodes.Path Edges
Only the edges that lie on such paths, together with their endpoints.Directed Paths
Subgraph consisting of directed paths involving the selected variables.Directed Path Edges
Only the edges that lie on those directed paths, together with their endpoints.Y Structures
Highlights Y-structures (collider patterns of the form X → Z ← Y with no edge between X and Y) that involve the selected variables.Pag Y Structures
The corresponding Y-structure patterns in PAGs, using PAG edge types.
Degree-based selections
These options select nodes based on their degree properties.
Indegree
Nodes whose indegree (number of incoming arrows) satisfies the chosen condition (equal / at most / at least some integer).Out Degree
Nodes whose outdegree (number of outgoing arrows) satisfies the chosen condition.Degree
Nodes whose total degree (number of incident edges, regardless of direction) satisfies the chosen condition.
In each case, you can specify the condition using the Degree controls at the bottom of the dialog: Equals, At Most, or At Least, together with a numeric threshold.
Summary
The Display Subgraphs tool lets you:
Focus on local neighborhoods (adjacents and relatives),
Examine causal families (parents, children, ancestors, descendants, Markov blankets),
Study path structures (paths, treks, directed paths, Y-structures),
Filter by degree properties.
It is especially powerful for large graphs, where directly seeing all of these structures in the full graph would be difficult or impossible.