Detail: Bootstrapping and Ensemble Graphs
Tetrad provides built-in support for bootstrapped causal discovery, allowing you to assess the stability and reliability of discovered edges and orientations.
Bootstrapping turns a single causal search into an ensemble of searches run on resampled versions of the data. The results are then summarized in both tabular and graphical form.
This page explains how bootstrapping works in Tetrad, how to configure it, and how to interpret the resulting ensemble outputs.
What Bootstrapping Does
When bootstrapping is enabled:
Tetrad repeatedly resamples the dataset.
The selected causal discovery algorithm is run on each resampled dataset.
The resulting graphs are collected.
Tetrad produces:
A summary (ensemble) graph
A detailed edge-frequency table
Multiple ensemble display options for visualization
The goal is not to “average” graphs, but to reveal which features are stable across resamples and which are fragile.
Enabling Bootstrapping
Bootstrapping is configured in the Bootstrapping section of the algorithm’s parameter panel.
Key parameters include:
Number of Bootstraps
Specifies how many bootstrap resamples to run.
A value of 0 disables bootstrapping.
Any positive value enables ensemble search.
Percentage of Resample Size
Controls the size of each resampled dataset (minimum 10%).
A value of 100% corresponds to standard bootstrap resampling.
Sampling With Replacement
If Yes, standard bootstrap sampling is used.
If No, subsampling without replacement is performed.
Include Original Dataset
Optionally includes the original dataset as an additional “bootstrap sample.”
Random Seed
Allows reproducible bootstrapping when set.
A value of –1 disables fixed seeding.
Number of Threads
Controls parallel execution of bootstrap searches.
Running a Bootstrapped Search
Once bootstrapping parameters are set:
Run the causal search as usual.
Tetrad executes the algorithm on each bootstrap sample.
A summary graph is produced.
Additional results become available in the Edges and Graph tabs.
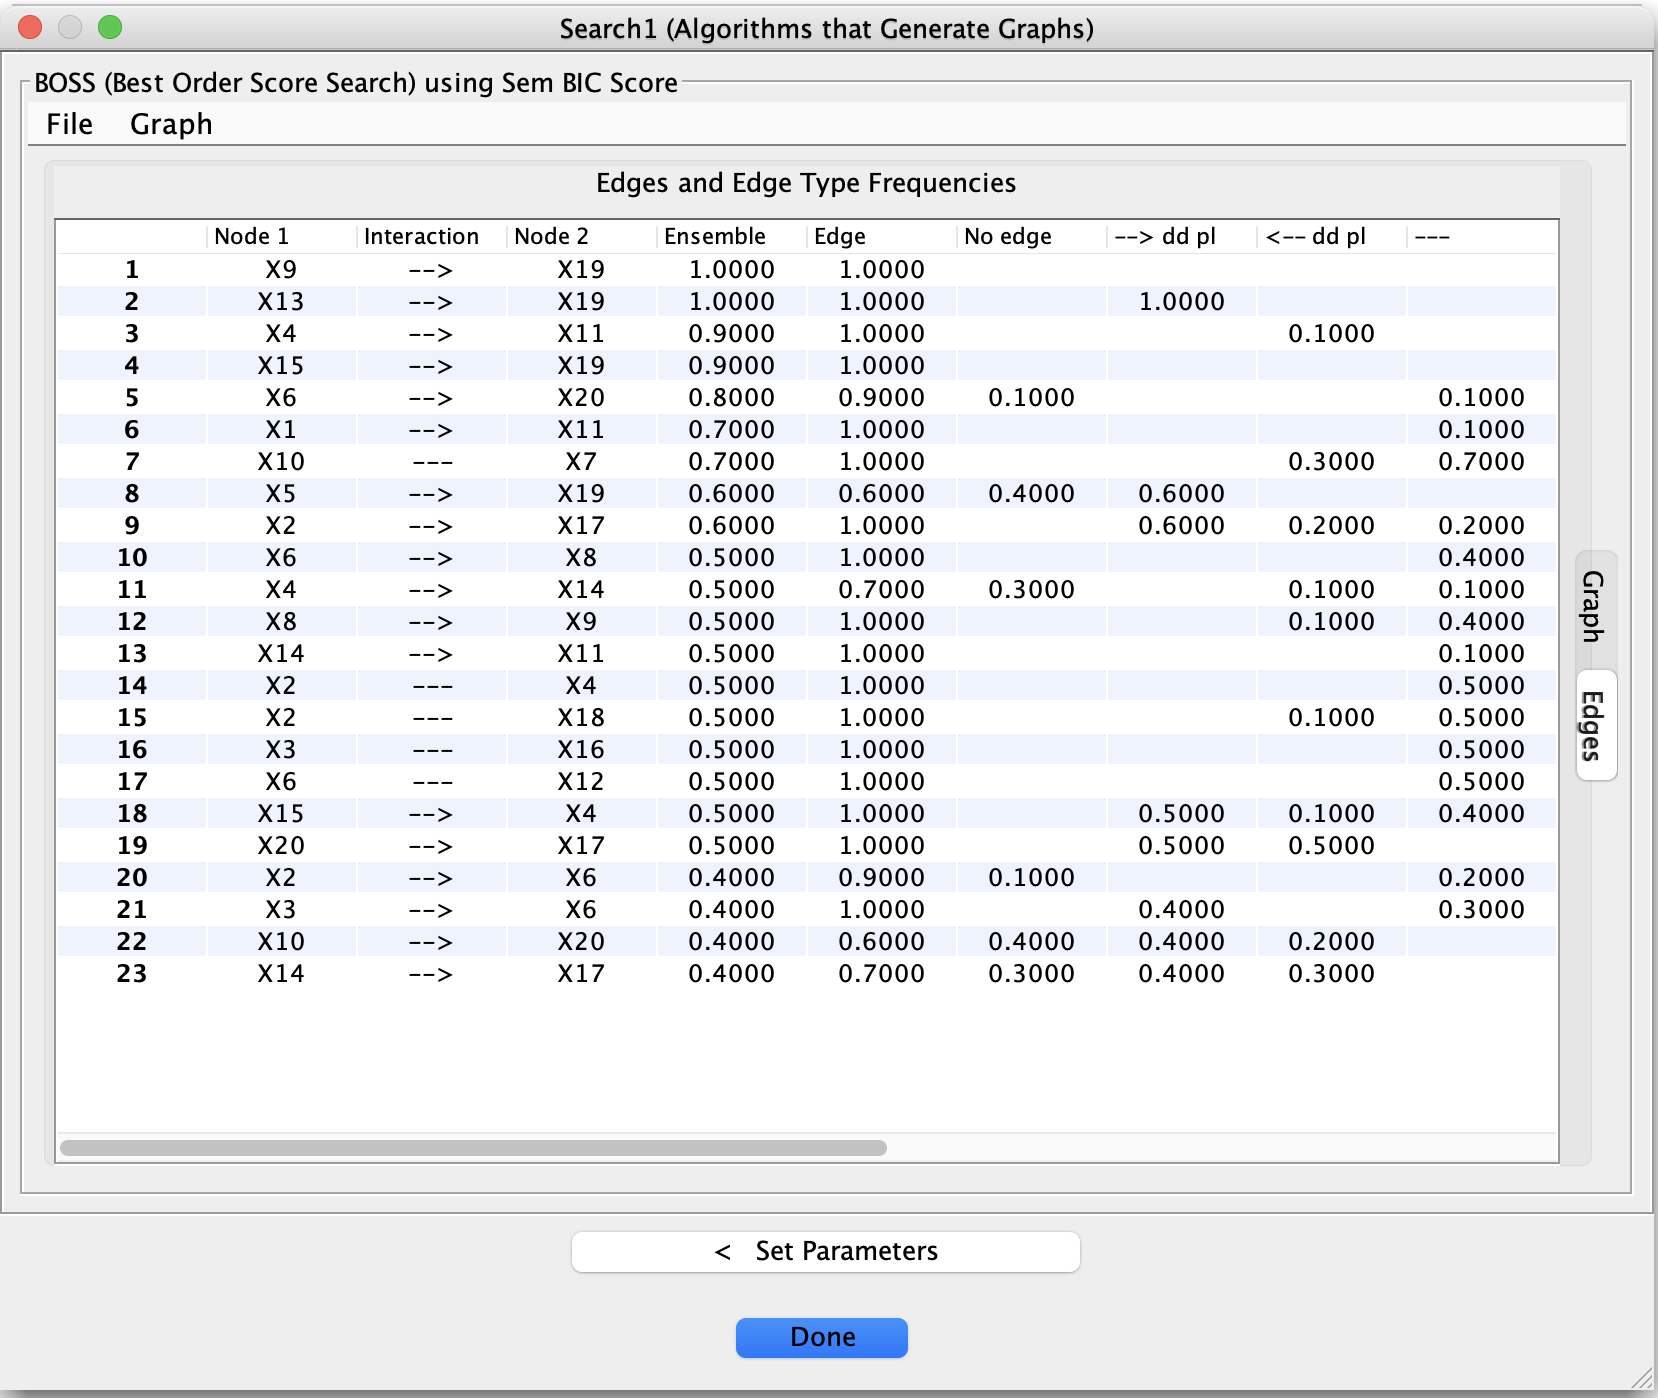
The Edges Tab: Bootstrap Frequencies
After a bootstrapped search, the Edges tab displays a table summarizing how often each edge (and each edge type) appeared across bootstrap samples.
Typical columns include:
Node 1 / Node 2
The pair of variables under consideration.Edge / No Edge Frequencies
How often an edge was present or absent.Orientation Frequencies
Frequencies for different edge types (e.g., →, ←, undirected, circle endpoints, bidirected).
These frequencies help answer questions such as:
Is this adjacency consistently present?
Is its orientation stable or ambiguous?
Does the data support an edge at all?
Low-frequency edges should generally be treated with caution.
Ensemble Graph Display Options
In the Graph tab, right-clicking on the graph opens an Ensemble Display submenu.
Available display modes include:
Highest
Shows the most frequently occurring edge type for each variable pair.Majority
Displays edges that appear in a majority of bootstrap samples.Preserved
Displays edges that consistently appear across samples.Threshold
Displays edges whose frequency exceeds a user-defined threshold.
These options allow you to visually explore trade-offs between stability and sparsity.
How to Use Bootstrapping Effectively
Bootstrapping is most useful when:
You want to assess robustness of discovered structure.
Multiple models pass diagnostic checks (e.g., Markov checking).
You suspect results may be sensitive to sampling variability.
Recommended practice:
Combine bootstrapping with Grid Search, not isolated runs.
Prefer edges that are stable across both parameter settings and bootstrap samples.
Treat unstable orientations as tentative, even if they appear in a single “best” model.
Important Caveats
Bootstrapping does not validate assumptions.
Stable edges can still be wrong if assumptions are violated.
Unstable edges are not necessarily false—they may reflect limited data or weak effects.
Bootstrapping complements, but does not replace, careful modeling and diagnostic evaluation.
Summary
Bootstrapping in Tetrad provides a principled way to:
Assess stability of causal discoveries
Visualize uncertainty in structure and orientation
Move beyond single-run conclusions
Used alongside Grid Search and Markov checking, it helps turn causal discovery into a robust, evidence-driven workflow rather than a one-shot procedure.