Main Window
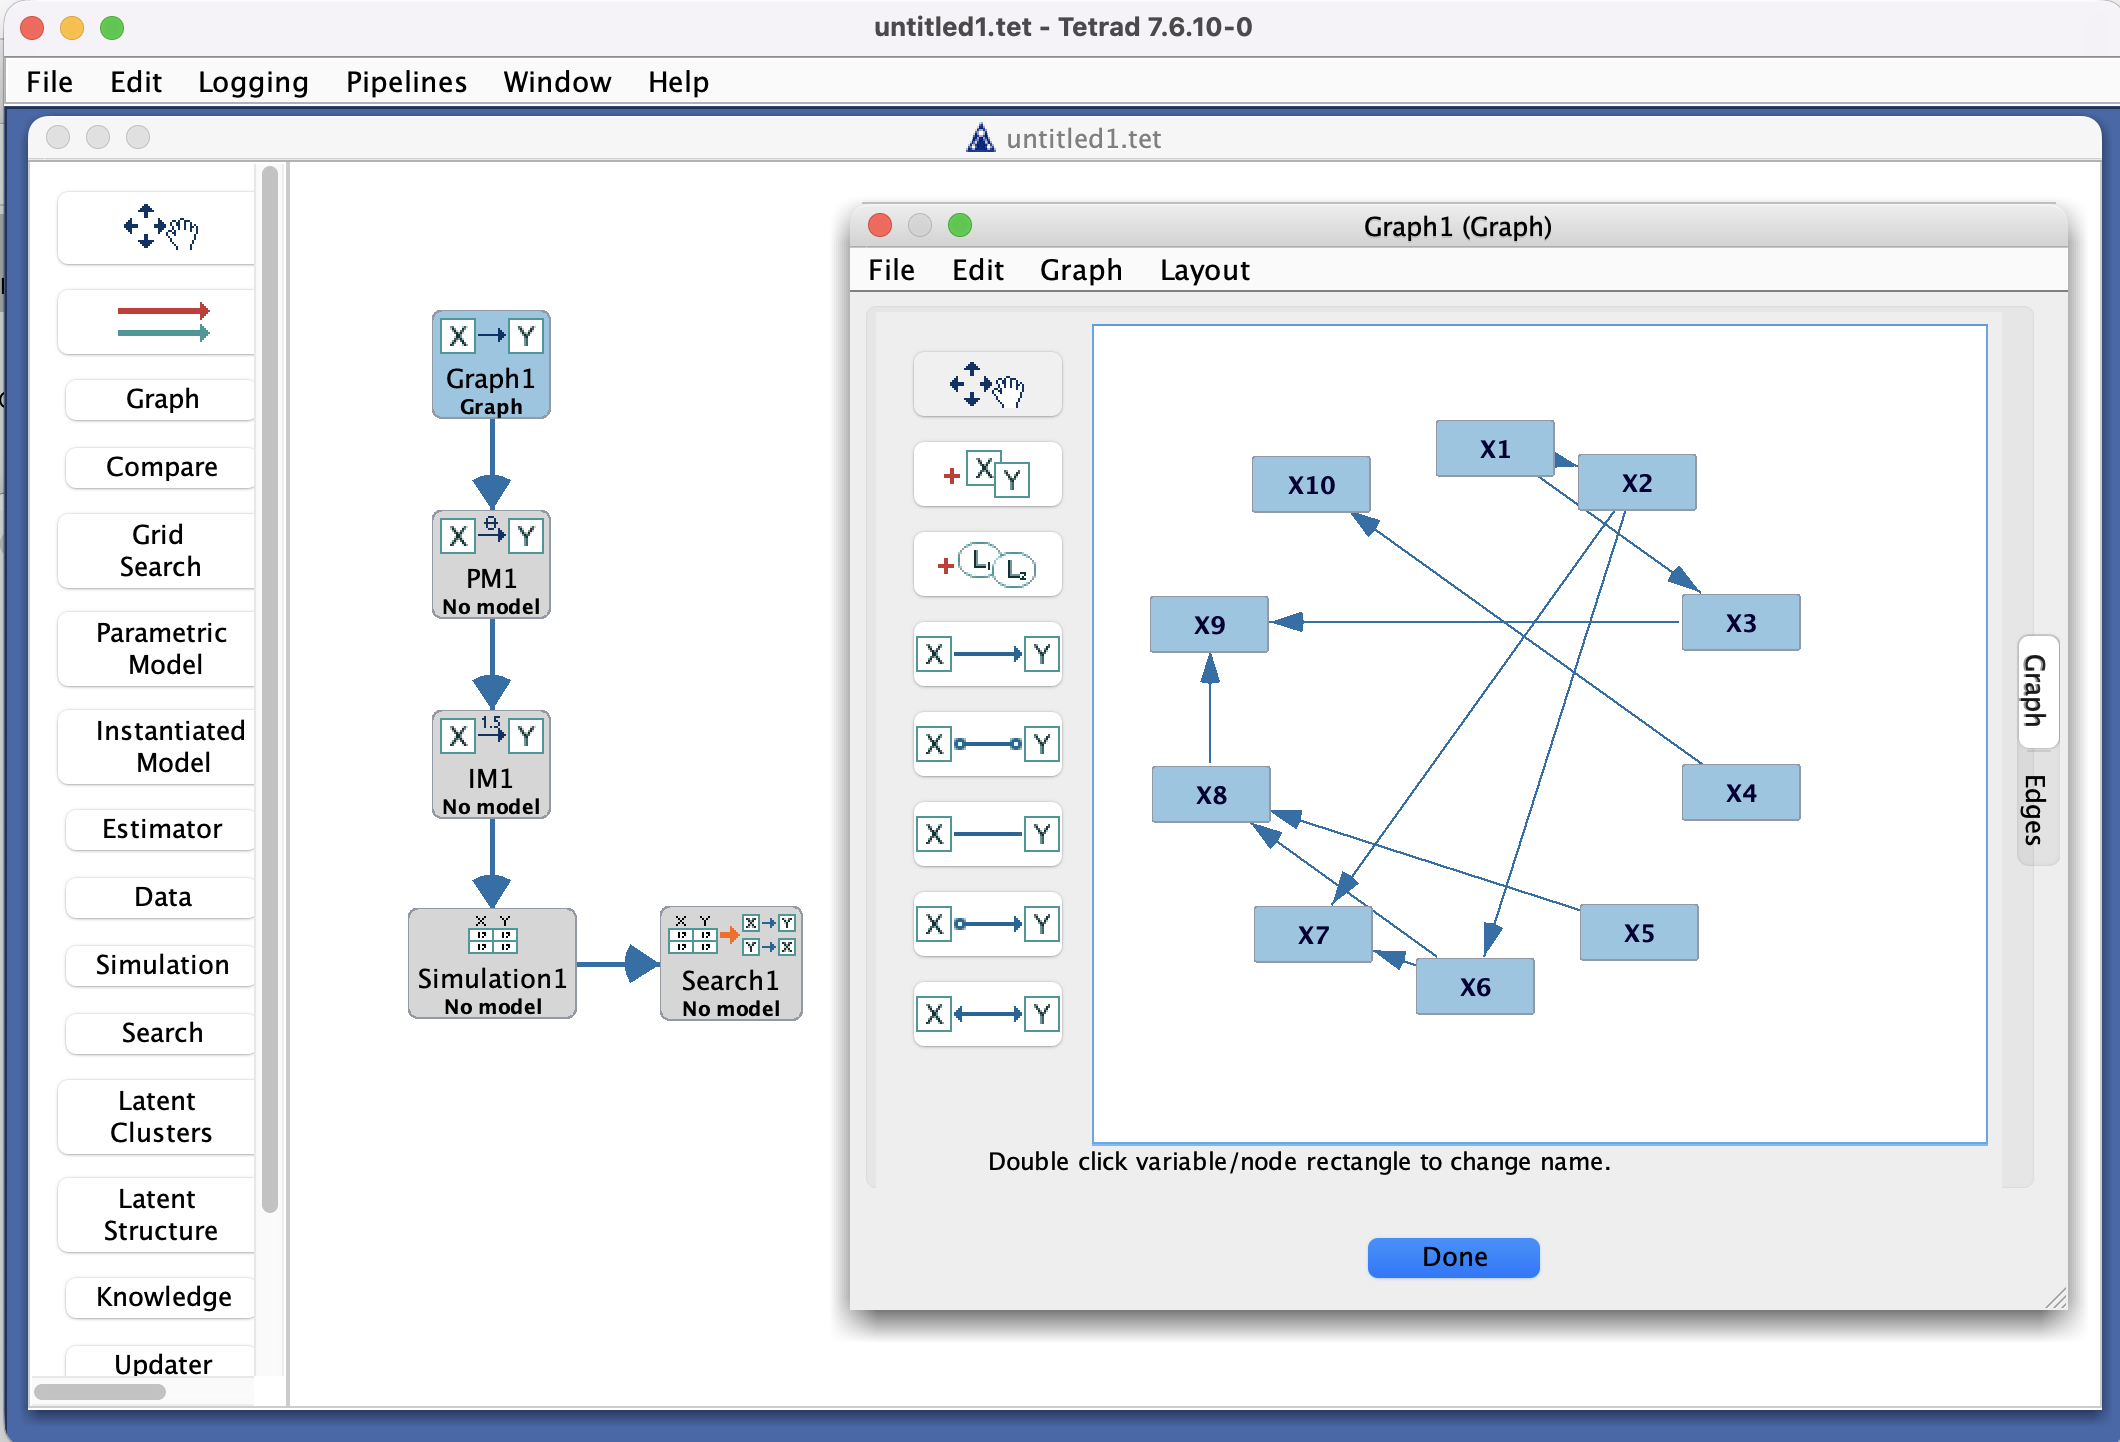
The Tetrad main window is the starting point for most workflows. It provides:
A menu bar and toolbar for global actions (open/save, logging, pipelines, etc.).
A project tree listing data sets, graphs, models, and results.
A work area where editors and result views appear in tabs.
A status bar (and optional logging pane) with progress and message reporting.
In a typical session you will:
Load or create data and graphs.
Configure algorithms in boxes (Data, Search, Compare, etc.).
Run algorithms and inspect their outputs in tabs.
Save the session for later.
Project tree
On the left, the project tree shows the objects in your current Tetrad session. Each entry corresponds to something you can open, run, or use as input to another tool:
Data nodes
Continuous data sets, mixed data sets, or covariance matrices.Graph nodes
DAGs, CPDAGs, PAGs, and other graph objects produced by search or imported from files.Algorithm and configuration nodes
Search boxes, simulation setups, estimators, updaters, and other configured tools.Result nodes
Graphs, tables, and reports created by algorithms and utilities.
You can usually:
Double-click a node to open it in the work area (for example, double-click a graph to open the graph editor).
Right-click a node to access context actions such as rename, delete, export, or run.
Drag certain nodes (such as graphs or data sets) into boxes on the workbench that accept them.
Deleting a node from the project tree removes it from the session; closing a tab in the work area does not.
Work area and tabs
The central work area displays one or more tabs. Each tab shows an editor or a result view associated with a node in the project tree:
Graph editors – interactive views where you can add, remove, and orient edges.
Data views – tables showing raw data, summary statistics, or covariance matrices.
Configuration dialogs – parameter settings for search algorithms, simulations, estimators, etc.
Result views – edge lists, fit indices, comparison tables, or logs of algorithm behavior.
Tabs can be opened and closed independently. Closing a tab does not delete the underlying node in the project tree; you can always re-open it by double-clicking the node again.
A common pattern is:
Double-click a configuration node (e.g., a Search box) to adjust parameters.
Run the configuration from the toolbar or context menu.
Double-click the resulting graph or table node to view the results in a new tab.
Status bar, logging pane, and messages
At the bottom of the main window, a status area reports:
Running tasks (for example, “Executing FGES…”).
Progress indicators, where available.
Warnings or errors reported by algorithms and tools.
When you choose Logging → Start Logging, a logging pane appears (typically docked above the status bar). This pane shows streaming log output from algorithms and utilities while they run. Choosing Logging → Stop Logging hides the logging pane and, if file logging is enabled, closes the current log file.
For long-running algorithms, you can watch both the status area and the logging pane to monitor progress, see any warnings, and, in some cases, cancel the run from the associated controls.