Compare Box
Compare Box in the Tetrad interface sidebar and main panel.
Purpose
The Compare box is where you run comparison tools that relate graphs, models, and (in some cases) data to one another.
Typically you:
Connect the Compare box to one or more Search or Graph boxes (and sometimes a Simulation or Data box).
Double‑click the Compare node on the workbench to choose a type of comparison.
View text output or open a more detailed interface that summarizes how well a graph or model matches a reference (often a true DAG from simulation) or matches other graphs.
The Compare box is especially useful when evaluating algorithms on simulated data or when comparing multiple search results.
Typical workflow
Place and connect a Compare box
Add a Compare box to the workbench.
Draw arrows from:
One or more Search or Graph boxes whose graphs you want to compare, and
Optionally a Simulation box (to supply a “true” DAG, its CPDAG, or its PAG), and/or a Data box (for Markov checks).
Choose a comparison type
Double‑click the Compare node on the workbench.
In the Types of Comparisons dialog, select one of the available tools (for example, Edgewise Comparison, Stat List Comparison, Misclassifications, Graph Intersections, Markov Check, IDA Check, or Model Fit), then click OK.
Run the comparison
Execute the Compare node (e.g., by pressing the run button in the workbench toolbar).
The Compare box produces text output and/or opens an auxiliary window or detail callout, depending on the chosen comparison type.
Inspect results
Read the printed summaries (edge lists, statistics, or tables) in the Compare output.
For comparisons that open a separate interface (e.g., Markov Check, IDA Check, Model Fit), use that interface to explore the detailed results.
Refine graphs or models
Use the feedback from the comparison to:
Adjust algorithm parameters in the Search box.
Modify graphs in the Graph box.
Refine models or estimation choices.
Types of comparisons
When you connect a Compare box to a Simulation box (truth) and a Search box (estimate), then double‑click the Compare node, you typically see a dialog like this:
Graph–Graph Comparisons
Edgewise Comparison
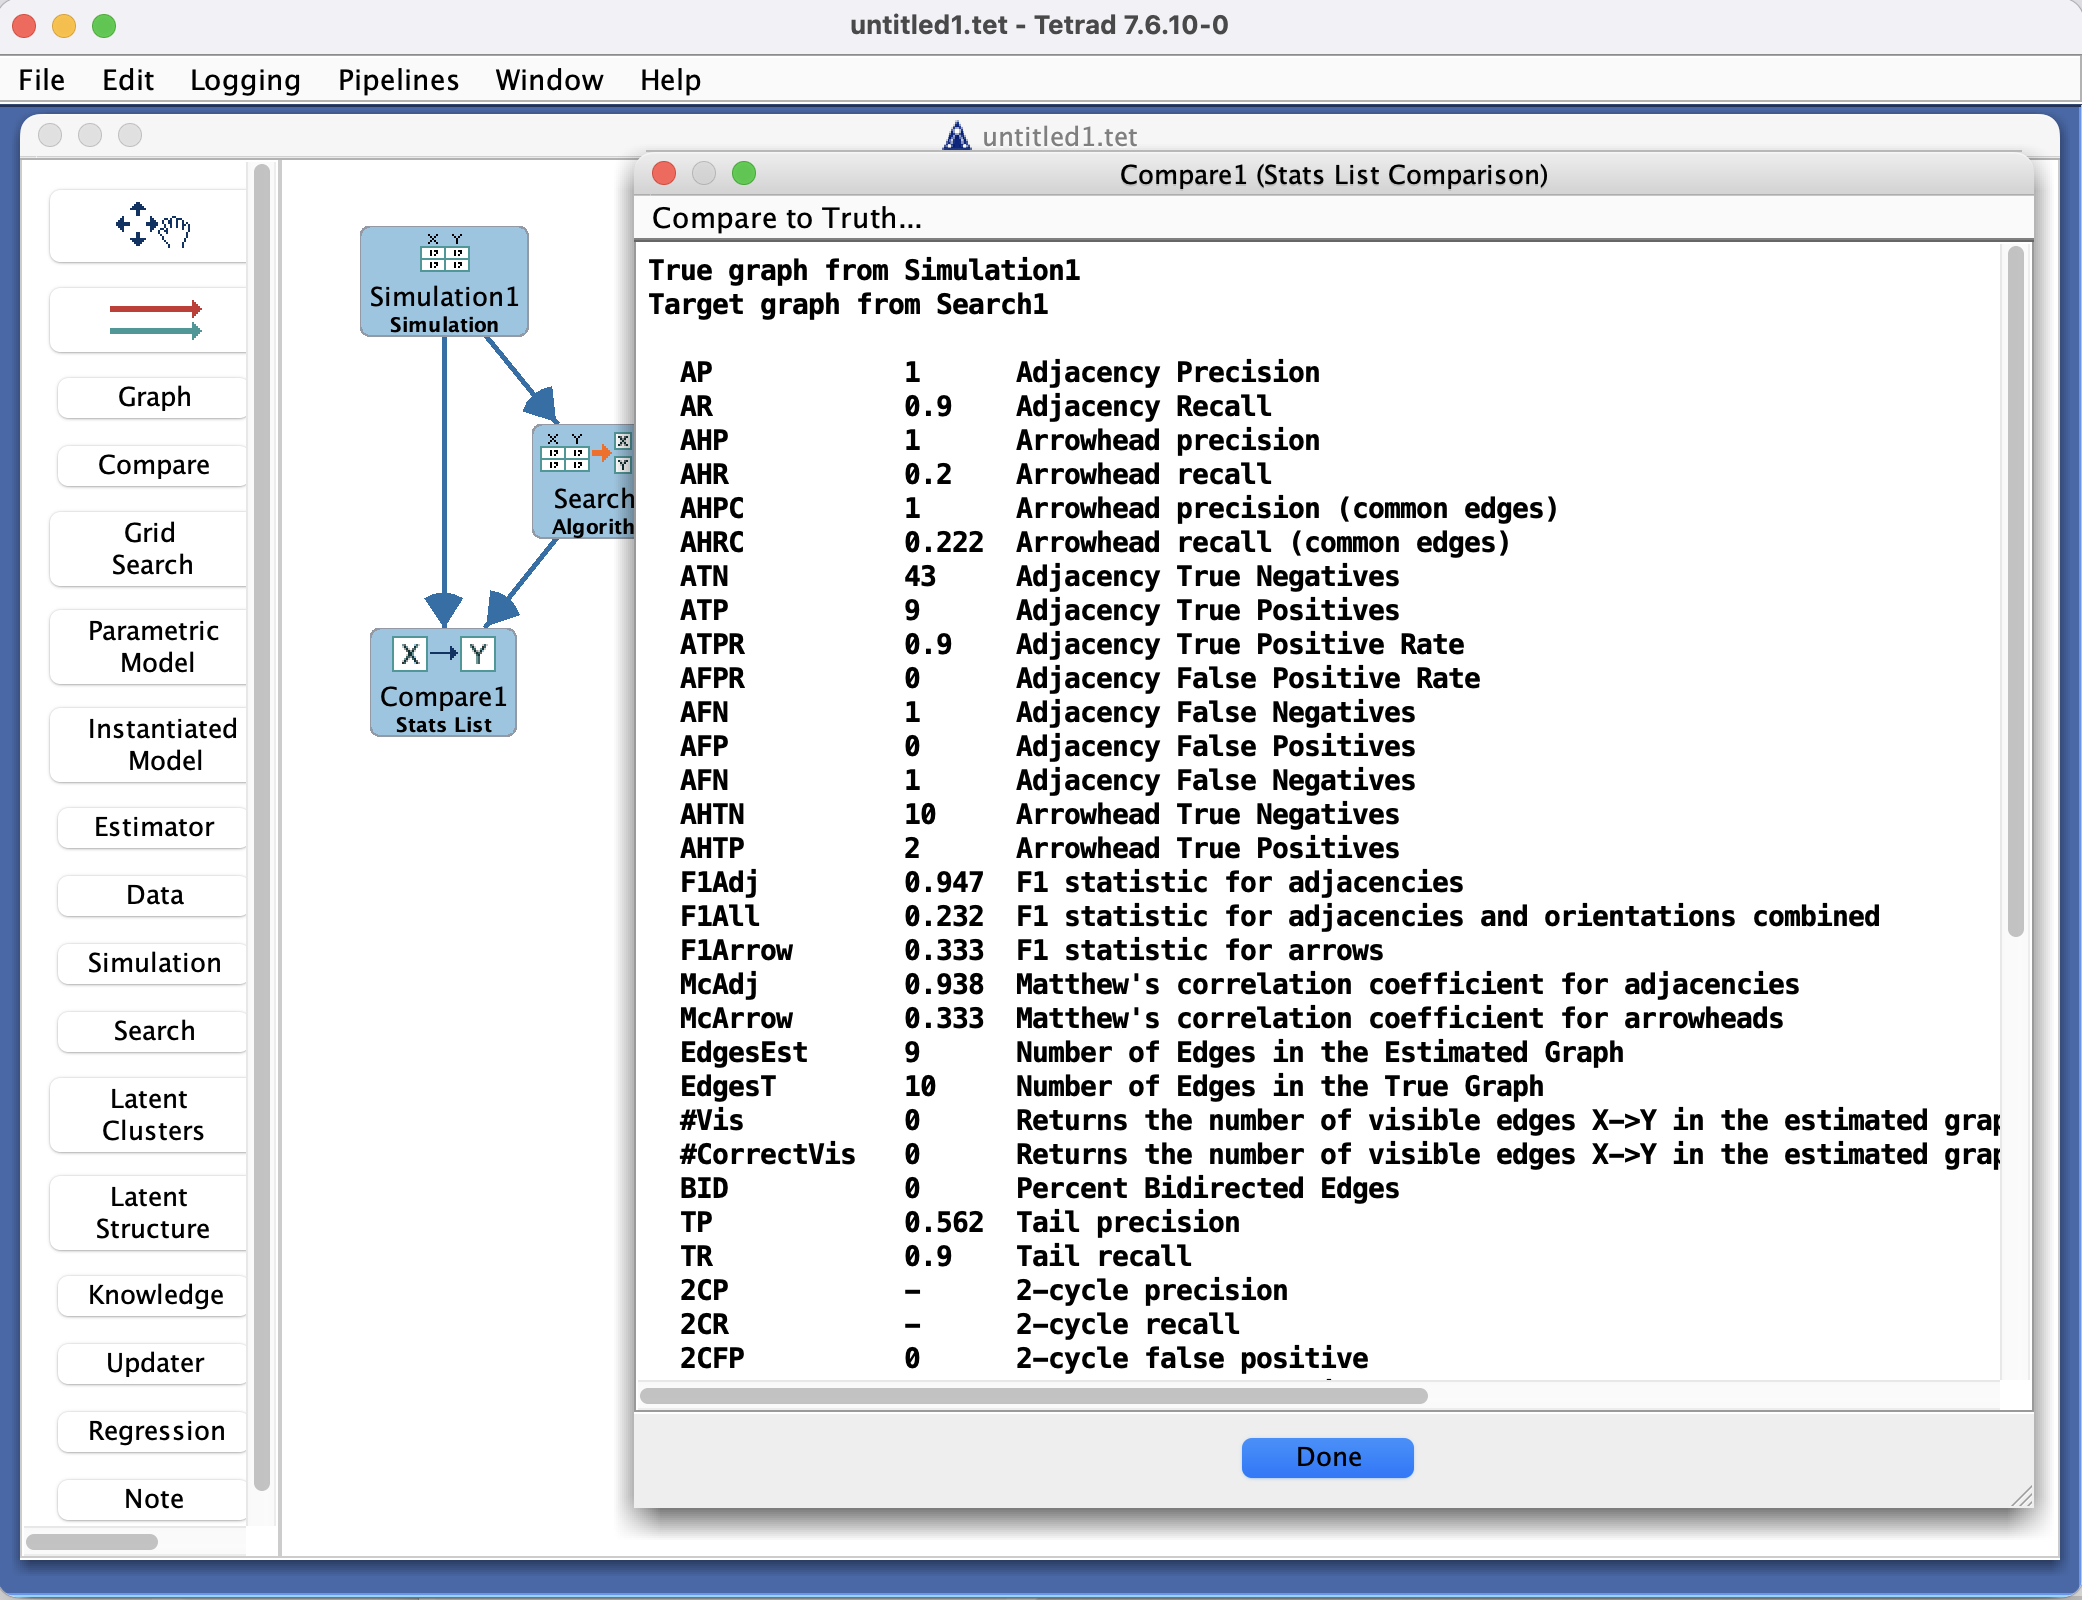
Stats List Comparison
Misclassifications
Graph Intersections
Independence Facts Comparison
Markov Check
IDA Check
Simulation–Algorithm Comparisons
Model Fit
Other specialized tools may appear when you connect different combinations of inputs (for example, multiple Search or Graph boxes).
Edgewise Comparison
Compares two graphs edge by edge, usually:
A “true” graph from Simulation, and
A “target” graph from Search.
The output describes, for example:
Adjacencies added (edges present in the target but not in truth, ignoring 2‑cycles and pure reorientations).
Adjacencies removed (edges present in truth but missing in the target).
Two‑cycles in truth correctly adjacent in estimated.
Edges incompatibly oriented (direction or marks contradict the true graph).
Edges compatibly oriented (consistent with truth but with different marks).
Edges correctly oriented.
You can choose whether to compare the estimated graph to:
The true DAG from Simulation,
The CPDAG of the true DAG, or
The PAG of the true DAG.
Stat List Comparison
Computes and prints a list of summary statistics comparing an estimated graph to a reference graph (true DAG / CPDAG / PAG). Examples include:
AP– adjacency precision.AR– adjacency recall.AHP– arrowhead precision.AHR– arrowhead recall.AHPC– arrowhead precision on common edges.AHRC– arrowhead recall on common edges.ATN,ATP,AFN,AFP, etc. – counts of true negatives, true positives, false negatives, and false positives for adjacencies, plus derived rates.
These statistics are useful for simulation studies where you want concise, comparable summaries across many runs.
Misclassifications
Produces misclassification tables that show, for each edge type, how often it was confused with other edge types.
Typical output includes:
An Edge Misclassification Table with rows for the true edge type (e.g.,
-->,<->,o->,---,no edge) and columns for the estimated edge type.An Endpoint Misclassification Table, focusing on marks at individual endpoints (e.g., tail, circle, arrowhead vs. “no endpoint”).
These tables help diagnose which edge marks are most often mis-estimated (for example, whether arrowheads are systematically missing).
Graph Intersections
When you give the Compare box two or more graphs as input, Graph Intersections reports:
For each integer k, edges that appear in exactly k of the input graphs (e.g., “In 2 graphs…”, “In 1 graph…”).
“Uncontradicted” edges that appear with compatible orientation across multiple graphs.
“Contradicted” edges whose directions or marks disagree across graphs.
This is useful when:
You are comparing multiple algorithms on the same data, or
You are aggregating results across multiple runs or datasets and want to see which edges are consistently present.
Markov Check
The Markov Check tool evaluates whether a model (typically a graph plus data) is Markov with respect to the data.
It typically uses an independence test to generate p‑values for a collection of separation statements implied by the model.
A model that is truly Markov with respect to the data should produce an approximately uniform distribution of p‑values.
The accompanying interface (described in a separate detail callout) shows:
Histograms or summaries of p‑values.
Additional statistics that quantify deviations from the Markov property.
See also:
Tetrad Interface → Detail: Markov Check(planned/elsewhere in the manual).
IDA Check
The IDA Check tool focuses on linear regression–based IDA bounds for each ordered pair of variables in the graph.
It displays:
Estimated bounds or effect ranges.
Summary statistics across pairs.
This is useful when you want to evaluate how well the graph and linear models support IDA-style intervention effect estimation.
Full details are given in a separate detail callout:
Tetrad Interface → Detail: IDA Check(planned/elsewhere in the manual).
Model Fit (Simulation–Algorithm Comparisons)
The Model Fit option connects to the Estimator machinery to evaluate how well a model fits the data.
Selecting Model Fit from the comparison types typically:
Creates or configures an Estimator box, or
Invokes an existing Estimator setup,
So that you can compute standard fit indices for the model implied by a graph.
This is especially useful when you want to go beyond purely structural comparisons and look at how well the model reproduces the covariance structure of the data.
Independence Facts Comparison
When you connect the Compare box to multiple Search or Graph boxes, an Independence Facts option becomes available.
This tool lets you compare d-separation (or m-separation for PAGs) facts across input graphs or models.
You can see where the graphs agree or disagree about conditional independence relations.
Because the interface is more involved, it is documented in a separate detail callout.
Key controls
Types of Comparisons dialog
Appears when you double‑click the Compare node on the workbench.
Lets you choose which comparison tool to apply, grouped into:
Graph–Graph Comparisons
Independence Facts Comparison
Simulation–Algorithm Comparisons
Workbench execution controls
Run / stop controls in the workbench toolbar execute the Compare node after a type has been chosen.
Output appears in:
A text pane associated with the Compare box, and/or
Additional windows/interfaces for tools like Markov Check, IDA Check, and Model Fit.
Common patterns & tips
In simulation studies:
Connect Simulation → Compare ← Search to compare learned graphs against known truth using Edgewise Comparison, Stat List Comparison, and Misclassifications.
When comparing multiple algorithms:
Connect several Search or Graph boxes to one Compare box and use Graph Intersections and Independence Facts Comparison to see which edges and independences are robust.
Use Stat List Comparison for tables in papers, and Edgewise Comparison or Misclassifications when you need detailed debugging information about specific edges.