Detail: N-tad Explorer
The N-tad Explorer is a data-analysis tool for finding rank-deficient covariance blocks in a dataset.
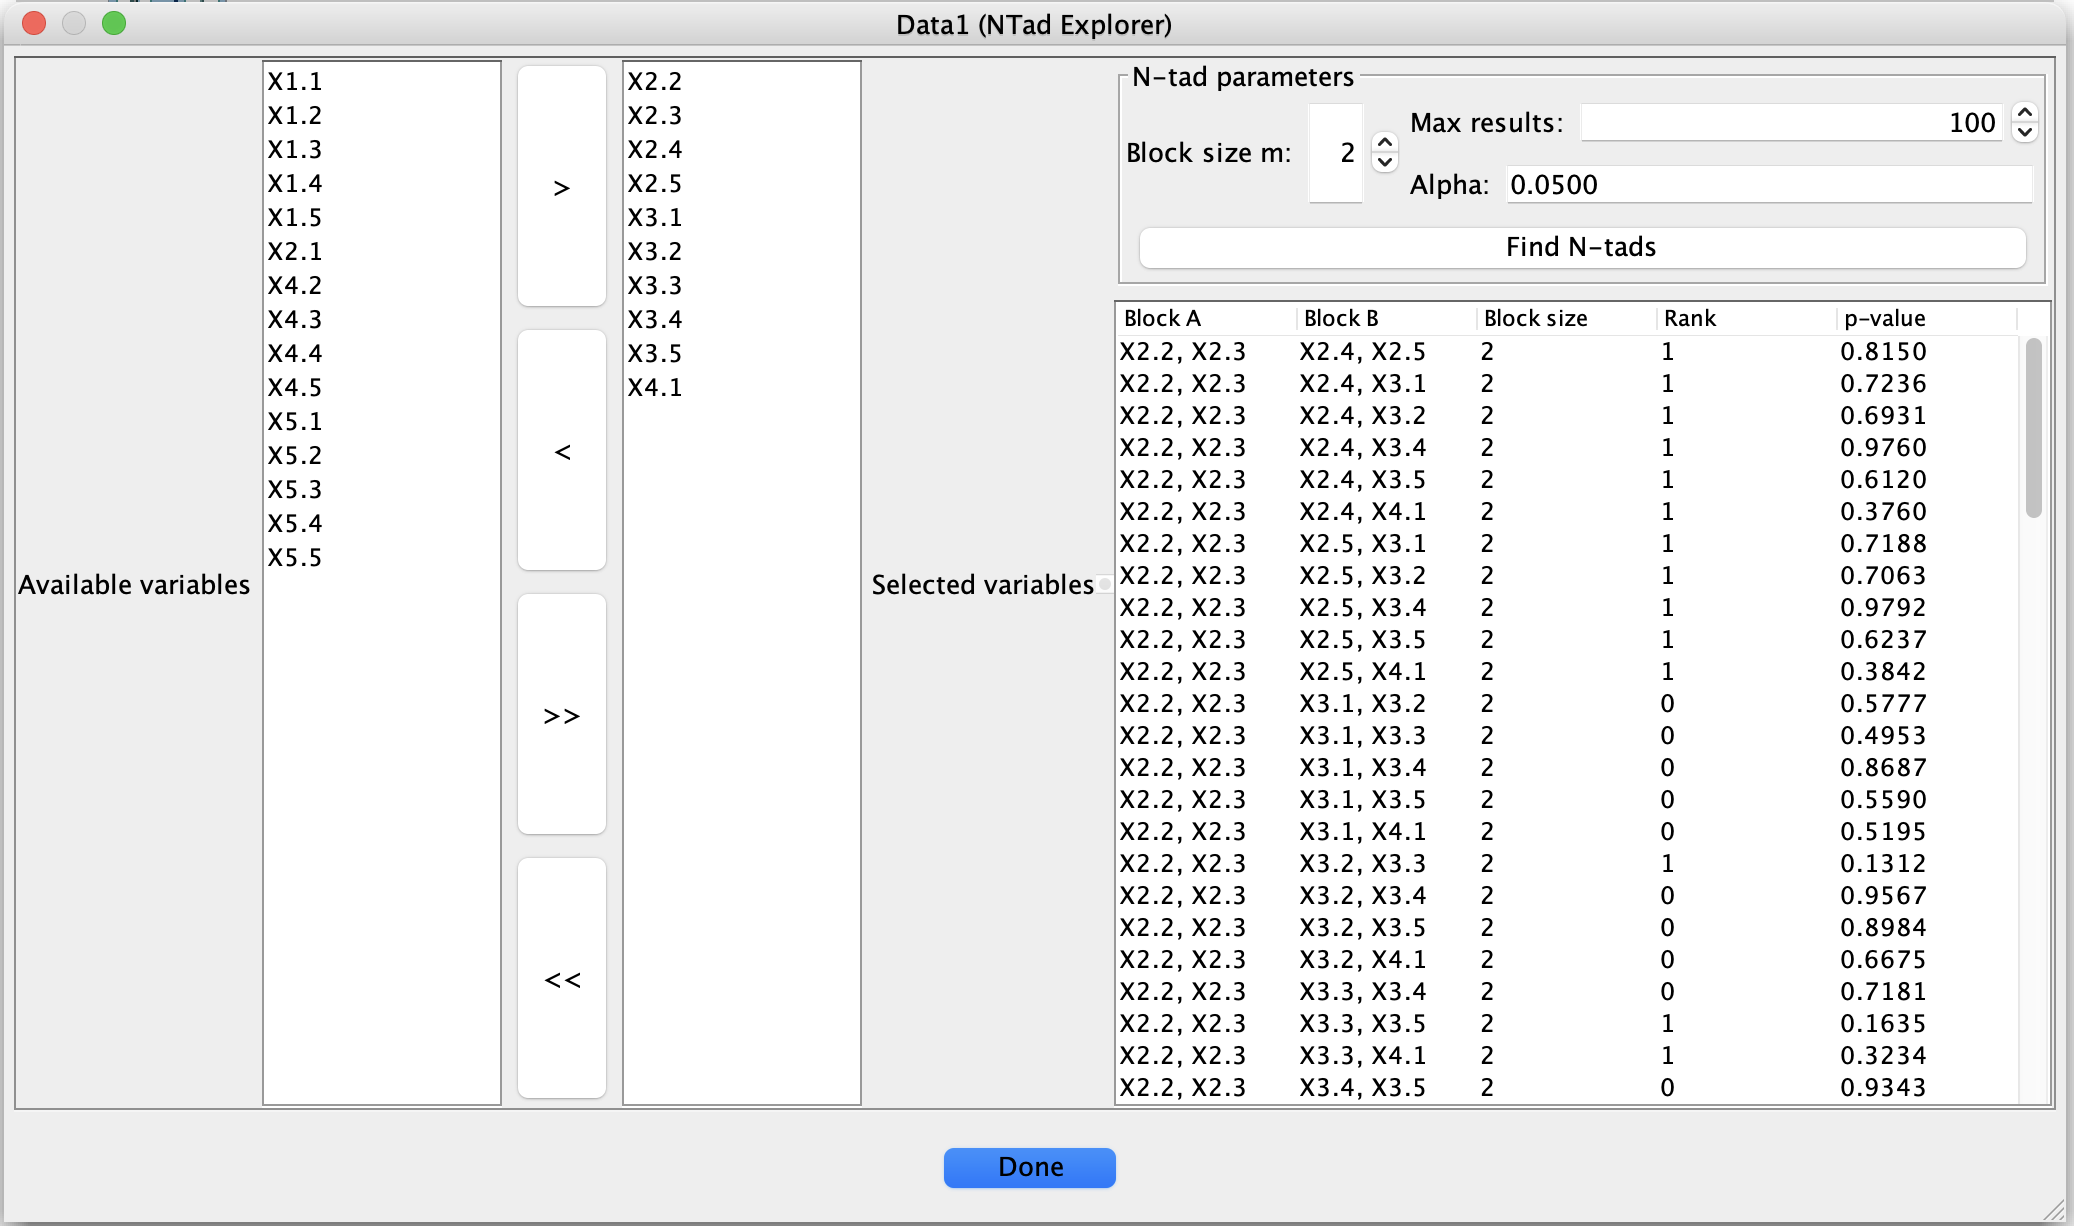
N-tad Explorer dialog for listing rank-deficient tetrads, sextads, and higher-order N-tads.
Given a dataset and a subset of variables, it:
enumerates disjoint pairs of variable blocks (A, B) of size m by m (for example, m = 2 for tetrads, m = 3 for sextads),
tests whether the cross-covariance block Sigma_AB has rank smaller than m, using regularized canonical correlation analysis (rCCA) and Wilks’ Lambda,
lists all rank-deficient blocks found, together with an estimated rank and a p-value.
This is useful for exploring latent variable structure (for example, Multiple Indicator Models) and for identifying interesting tetrads, sextads, and higher-order N-tads suggested by the data.
Basic workflow
Create an N-tad Explorer box
Start from a Data box containing the dataset you want to analyze.
Add an N-tad Explorer box connected to that Data box.
Open the N-tad Explorer box to bring up the dialog.
Select variables
The left side of the dialog shows two lists:
Available variables – all variables in the input dataset,
Selected variables – the variables that will be used to form N-tads.
Use the arrow buttons between the lists:
> moves the selected variables from Available to Selected,
< moves them back,
>> moves all variables to Selected,
<< clears the selection.
Only the variables in the Selected variables list are used when forming blocks.
Set N-tad parameters
In the N-tad parameters panel, specify:
Block size m
The size of each block A and B, so each N-tad uses 2m variables:m = 2 → tetrads (2 by 2 blocks),
m = 3 → sextads (3 by 3 blocks),
m = 4 → octets (4 by 4 blocks), etc.
Max results
The maximum number of rank-deficient blocks to list.
This limits the amount of output when many N-tads satisfy the test.Alpha
The significance level for the Wilks rank test used to estimate the rank.
Typical values are 0.05 or 0.01.
Run the search
Click Find N-tads to:
construct all disjoint pairs (A, B) of size m from the selected variables,
estimate the rank of Sigma_AB using Wilks Lambda,
compute a p-value for the hypothesis that the rank is at most m - 1,
keep only those blocks that are rank-deficient (estimated rank less than m).
The results appear in the table on the right-hand side.
Inspect and sort results
Each row of the table corresponds to one rank-deficient block and contains:
Block A – comma-separated list of variables in block A,
Block B – comma-separated list of variables in block B,
Block size – the value of m used,
Rank – the estimated rank of Sigma_AB,
p-value – p-value for the null hypothesis that rank(Sigma_AB) is less than or equal to m - 1.
You can click on any column header to sort the table by that column:
first click: sort ascending,
second click: sort descending,
third click: return to the original order.
Interpretation
A row with Block size = m and Rank = r < m indicates that the corresponding m by m cross-covariance block Sigma_AB is estimated to have rank r rather than full rank m.
A small p-value suggests strong evidence against the null hypothesis that the rank is at most m - 1; conversely, a larger p-value indicates that the data are compatible with a lower-rank structure at the specified alpha level.
In practice, for Multiple Indicator Models and related latent-variable structures, particular rank patterns (for example, tetrads with rank 1 instead of 2) can reflect underlying constraints implied by the latent variables.
The N-tad Explorer does not modify the original dataset; it only summarizes which blocks of variables show evidence of rank deficiency according to the chosen test.
Tips and notes
Choice of variables.
Restricting the Selected variables to plausible indicator sets can greatly reduce runtime and focus the results on blocks of interest.Combinatorial growth.
The number of candidate blocks grows quickly with:the number of selected variables, and
the block size m.
Use Max results and a moderate block size to keep the output manageable.
Reproducibility.
The list of results is stored with the N-tad Explorer box. If you save and reopen the project, the last computed results remain available in the table until you run the search again with different settings.Exporting results.
If desired, you can copy the rows from the table into an external tool (such as a spreadsheet or script) for further analysis, or cross-reference the listed blocks with latent variable models you are fitting elsewhere.
Using N-tad Explorer with SEMs
To list tetrads, sextads, and octads implied by a fitted SEM:
Fit a SEM from a covariance matrix using a SEM Est or SEM IM box.
Create a Data box for the implied covariance (measured variables) from the SEM.
Attach an N-tad Explorer box to that implied covariance Data box.
Run N-tad Explorer with your chosen block size (m = 2, 3, 4, …).
In this setup, the rank-deficient blocks reported by N-tad Explorer correspond to N-tads implied by the estimated SEM, rather than N-tads in the raw data.