Data Box
Data Box in the Tetrad interface sidebar and main panel.
Purpose
The Data box is where you work with datasets in a Tetrad project. Each Data box shows one or more datasets or covariance matrices (or lists of these) in the current session, lets you load new ones, and inspect their contents. By attaching new datasets to an existing dataset by drawing an arrow and double-clicking, various transformations of the data can be applied, from copying the data to randomly reordering a column.
In a typical workflow you will load data here first, then use it in Search, Regression, Estimator, Simulation, and other boxes.
Typical workflow
Load or import a dataset
Use the Load or Import button in the toolbar of the Data box.
Choose a supported file format (e.g., tab-delimited text, CSV).
Specify options such as:
Whether the first row is a header with variable names.
Delimiter or separator.
Encoding for missing values.
Inspect and clean
Select a dataset in the list to show it in the main panel.
Use the data viewer to inspect:
Variable names and types (continuous, discrete, mixed).
Basic summaries (e.g., number of cases, missingness).
Apply any available transformations (depending on the tools exposed in your version), such as:
Dropping or reordering variables.
Subsetting rows (e.g., filtering cases).
Discretizing or standardizing variables.
Use in other boxes
In Search, Regression, Estimator, and Simulation, choose datasets from drop-down lists that are populated from the Data box.
Run analyses, searches, and simulations using these datasets as inputs.
Save your project
When you save a Tetrad project, the datasets defined in the Data box (including any transformed copies) are saved along with graphs, models, and other objects.
These may also be saved out using the File menu or loaded as needed.
Key controls
Toolbar
Load / Import – load data from a file.
Copy / Delete – manage existing datasets.
Export – write a dataset to a file.
(When available) Transform – open dialogs for common data transformations.
Data list
Shows all datasets currently in the project.
Selecting an entry updates the main panel with that dataset.
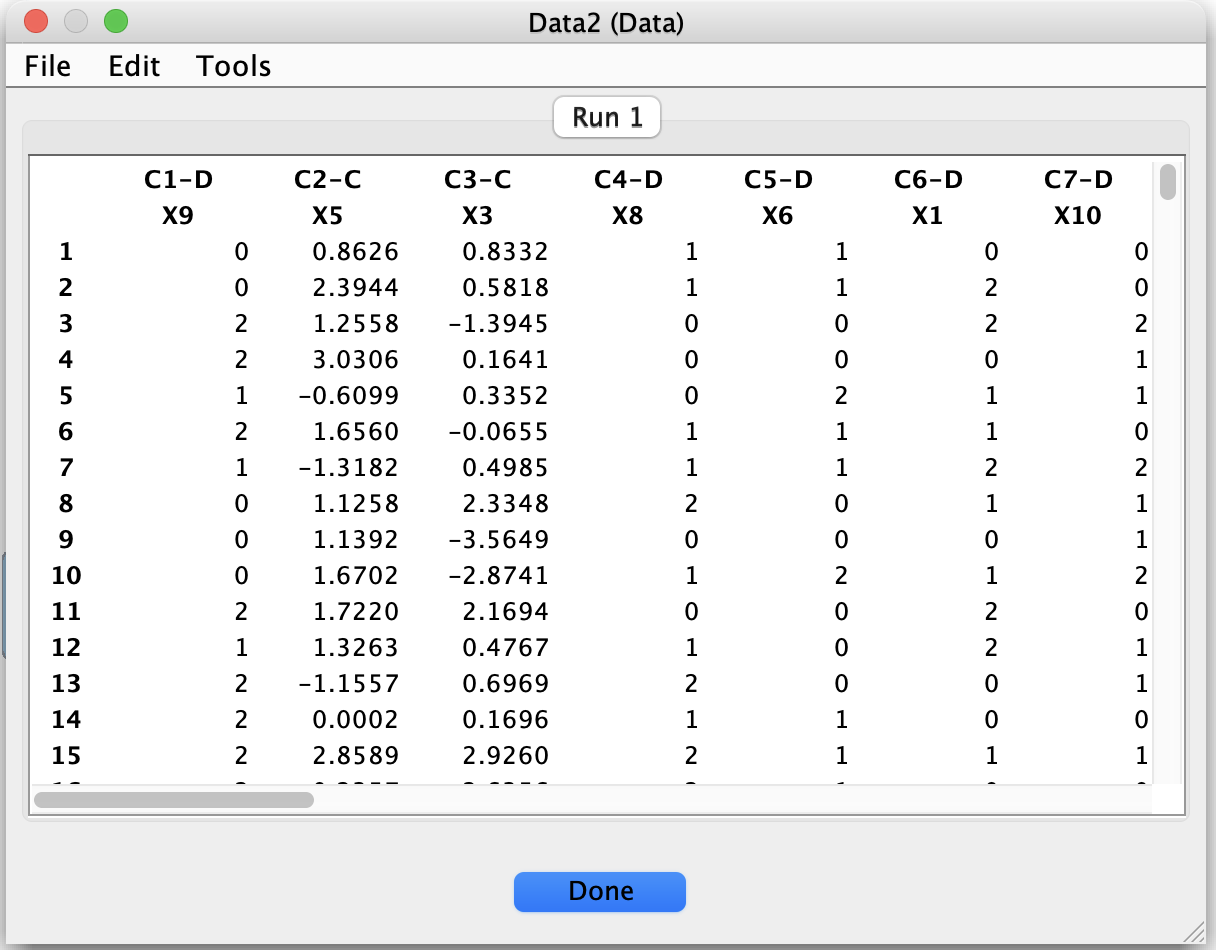
Main panel
Displays the selected dataset in a tabular viewer.
May include:
Variable-level information (name, type, domain).
Case-by-case values.
Summary information or diagnostic messages.
Common patterns & tips
Ensure that variable names are informative and consistent, especially when using multiple datasets or exporting results.
When exploring model robustness:
Create duplicated datasets with different preprocessing (e.g., standardized vs. raw) and run searches on each version.
Be careful when editing variable types or running searches on datasets with mixed types:
Some algorithms assume continuous variables; others are designed for discrete or mixed data.
Mismatched types can lead to errors or misleading results.